Figure A
Supported PWWP relationships
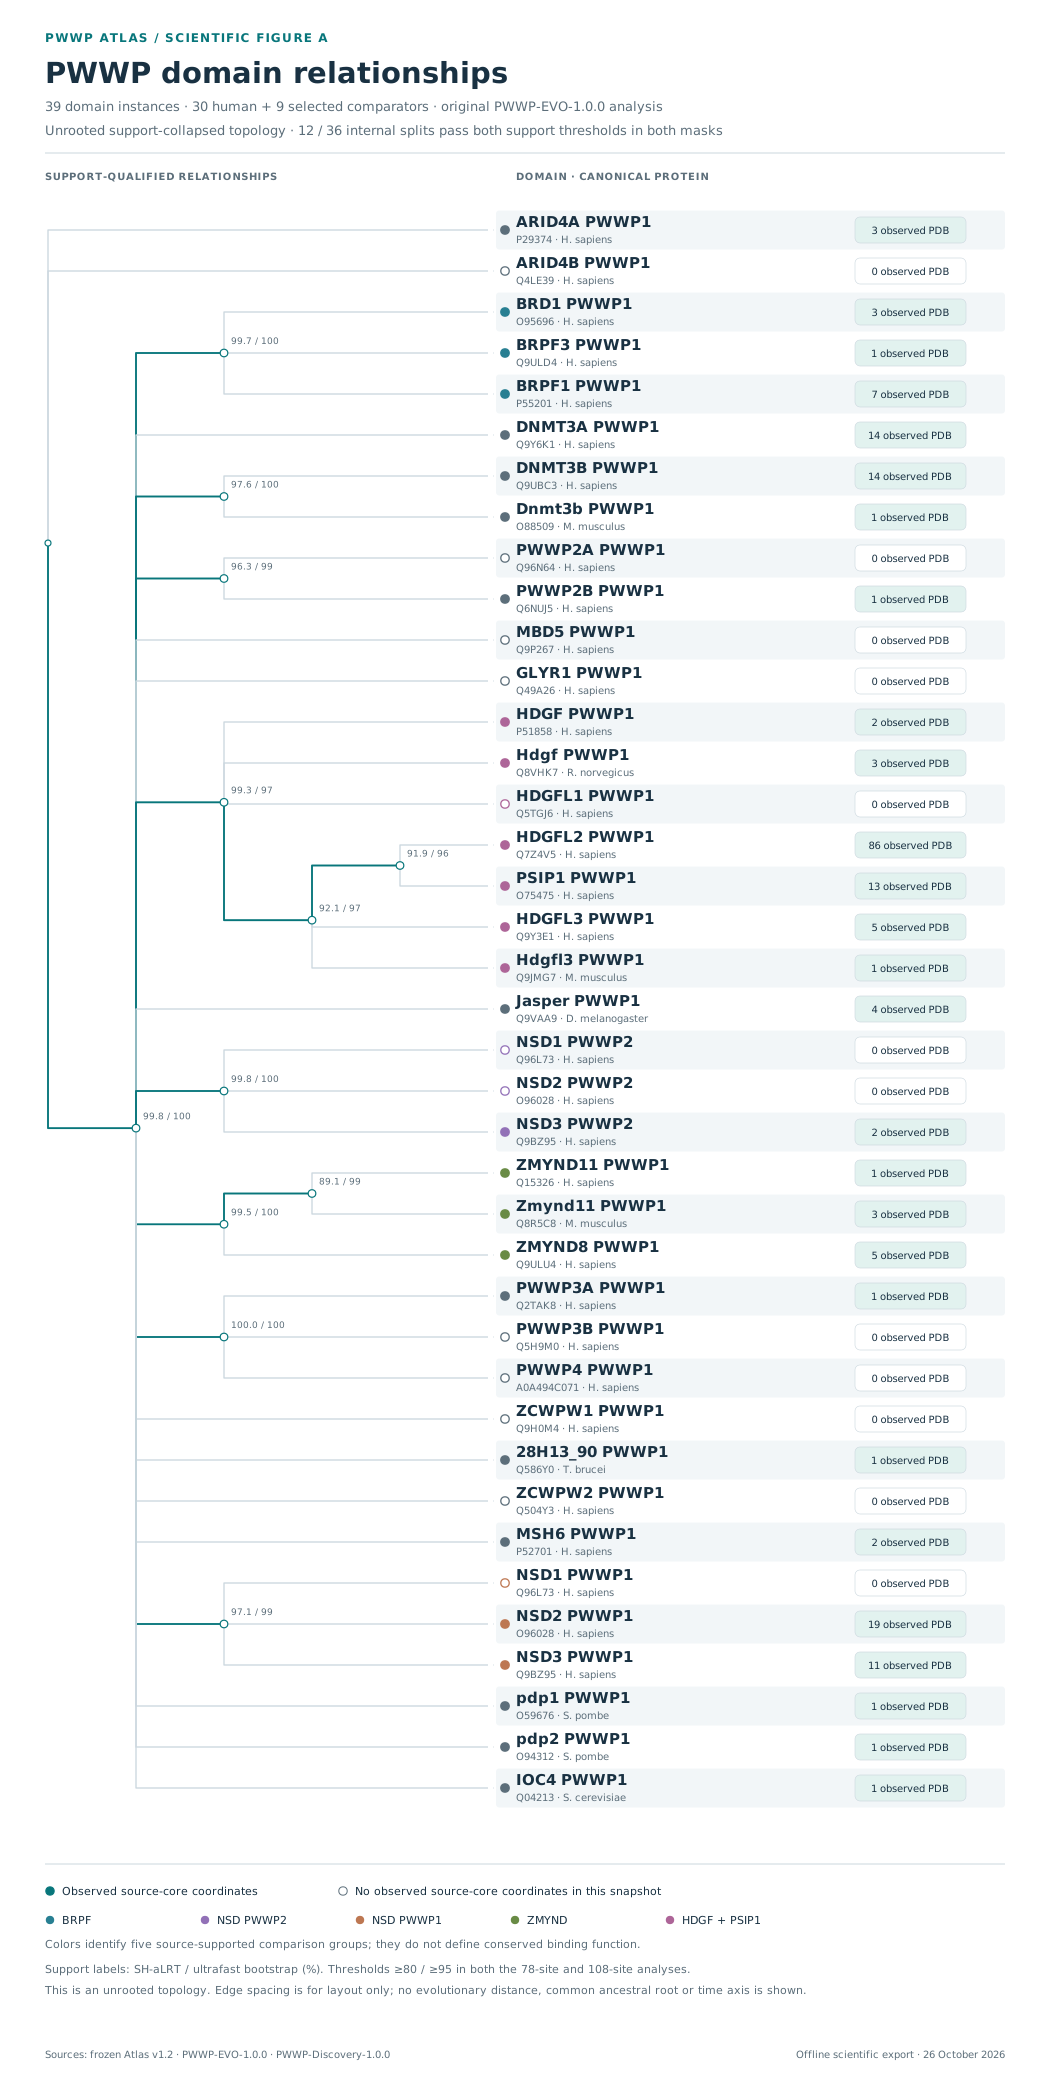
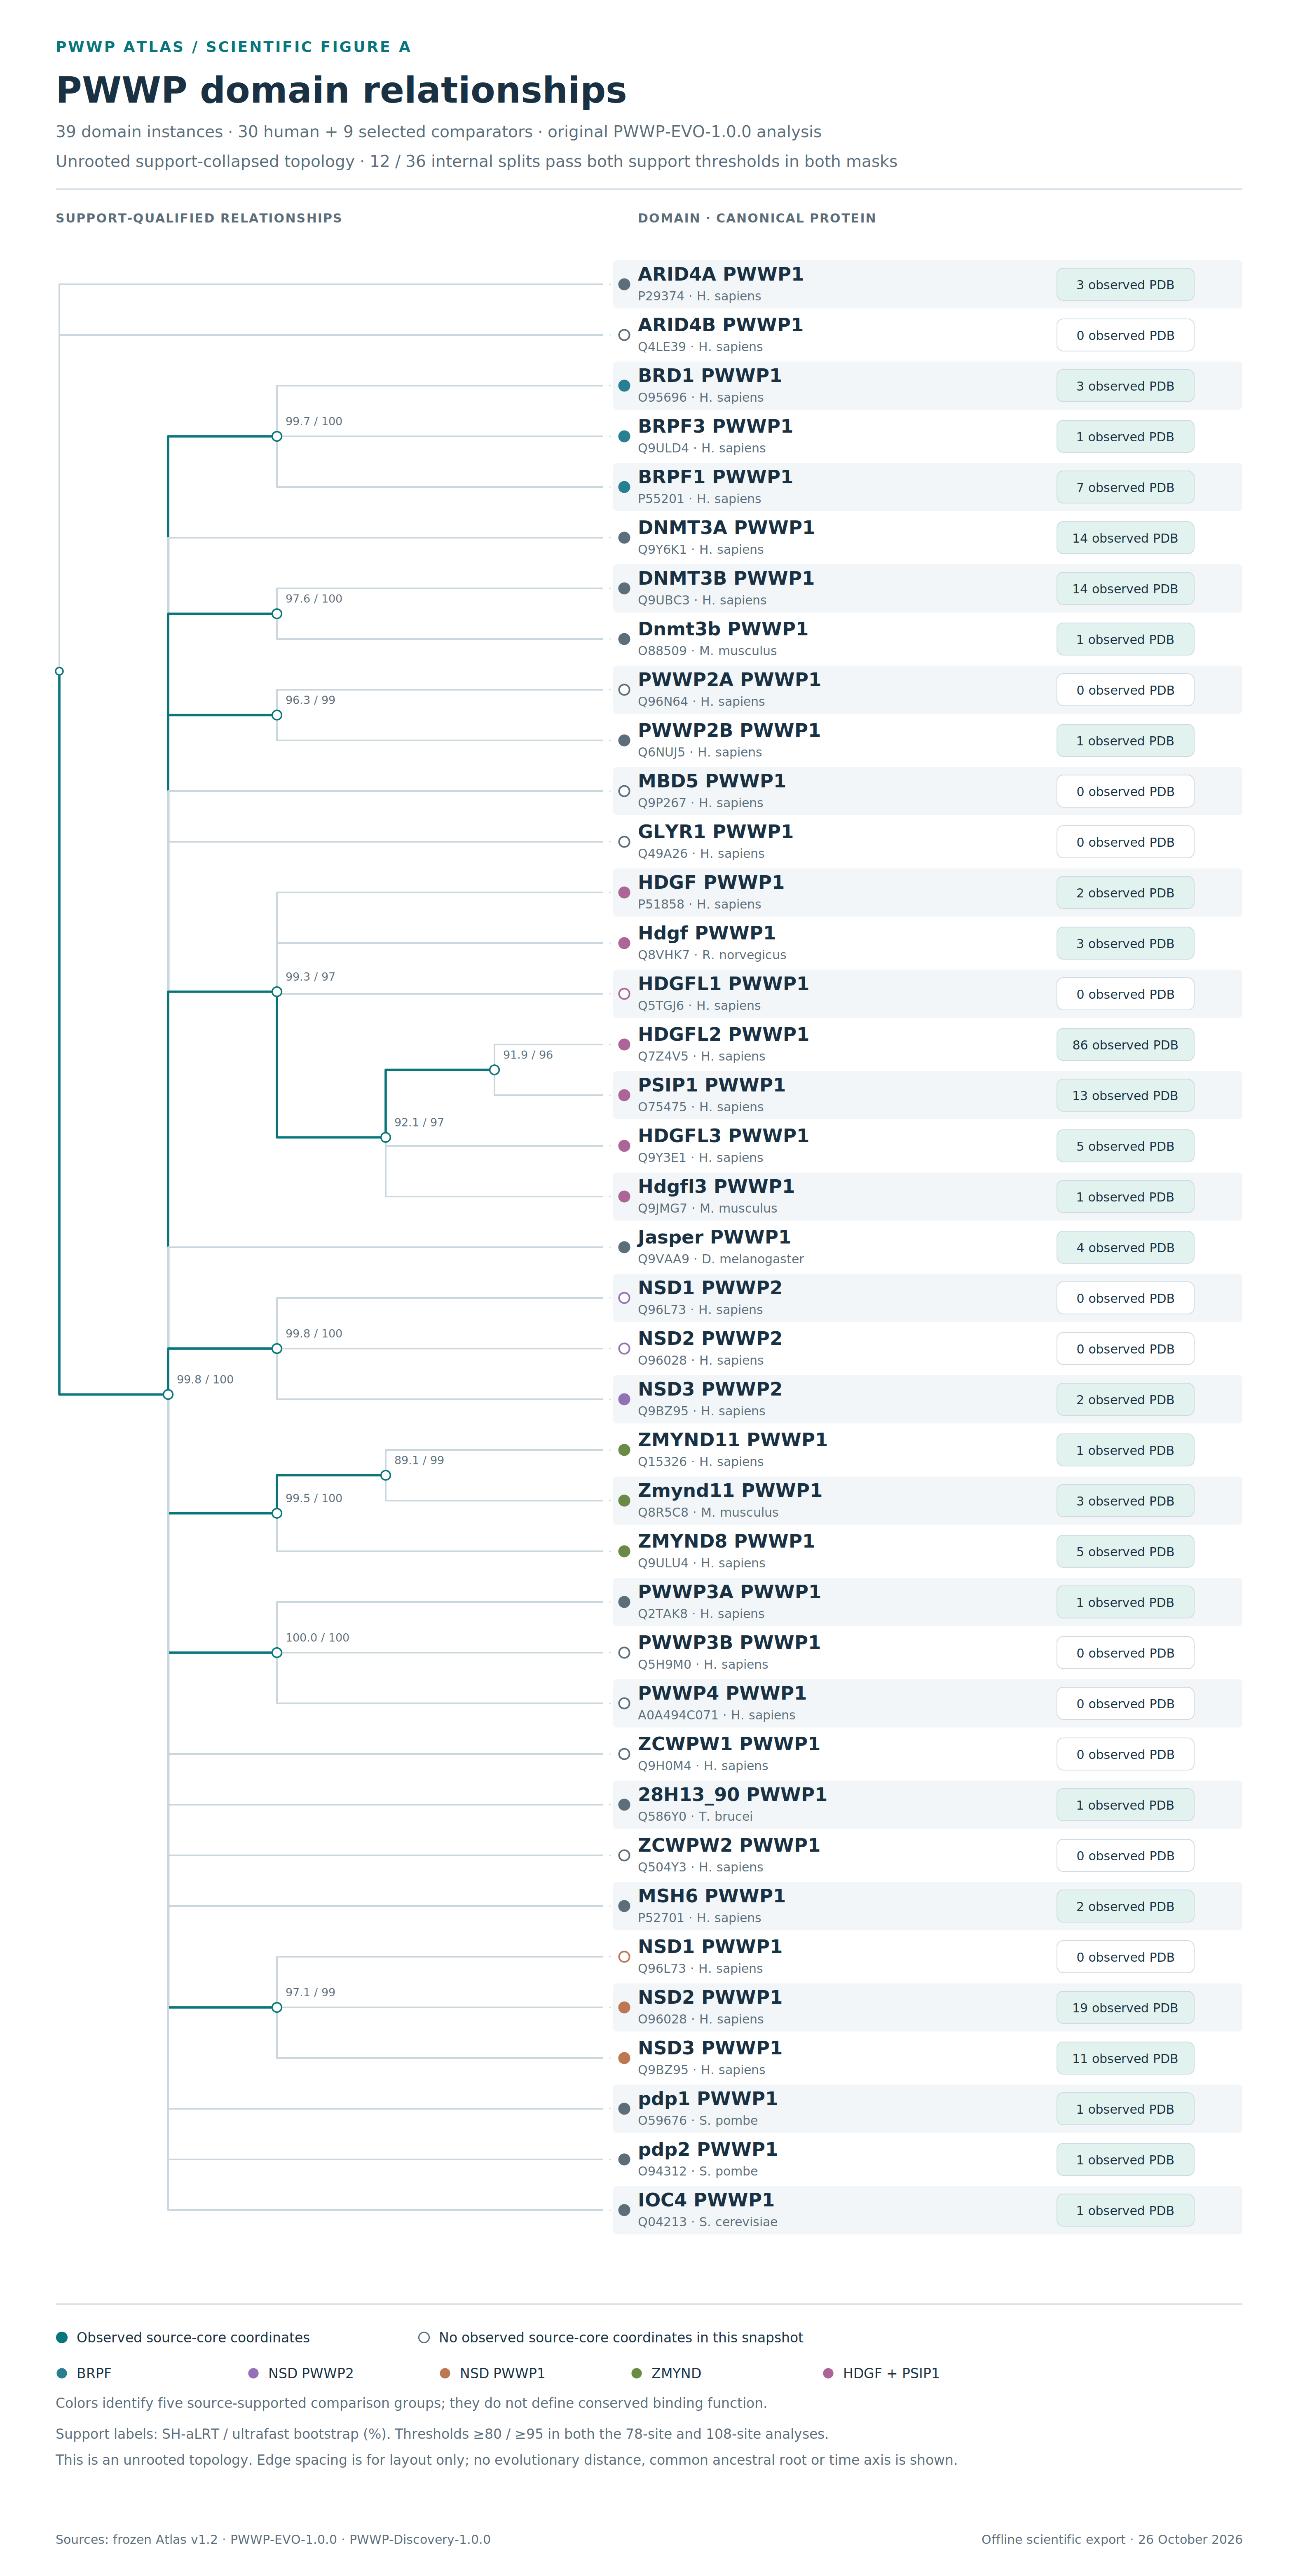
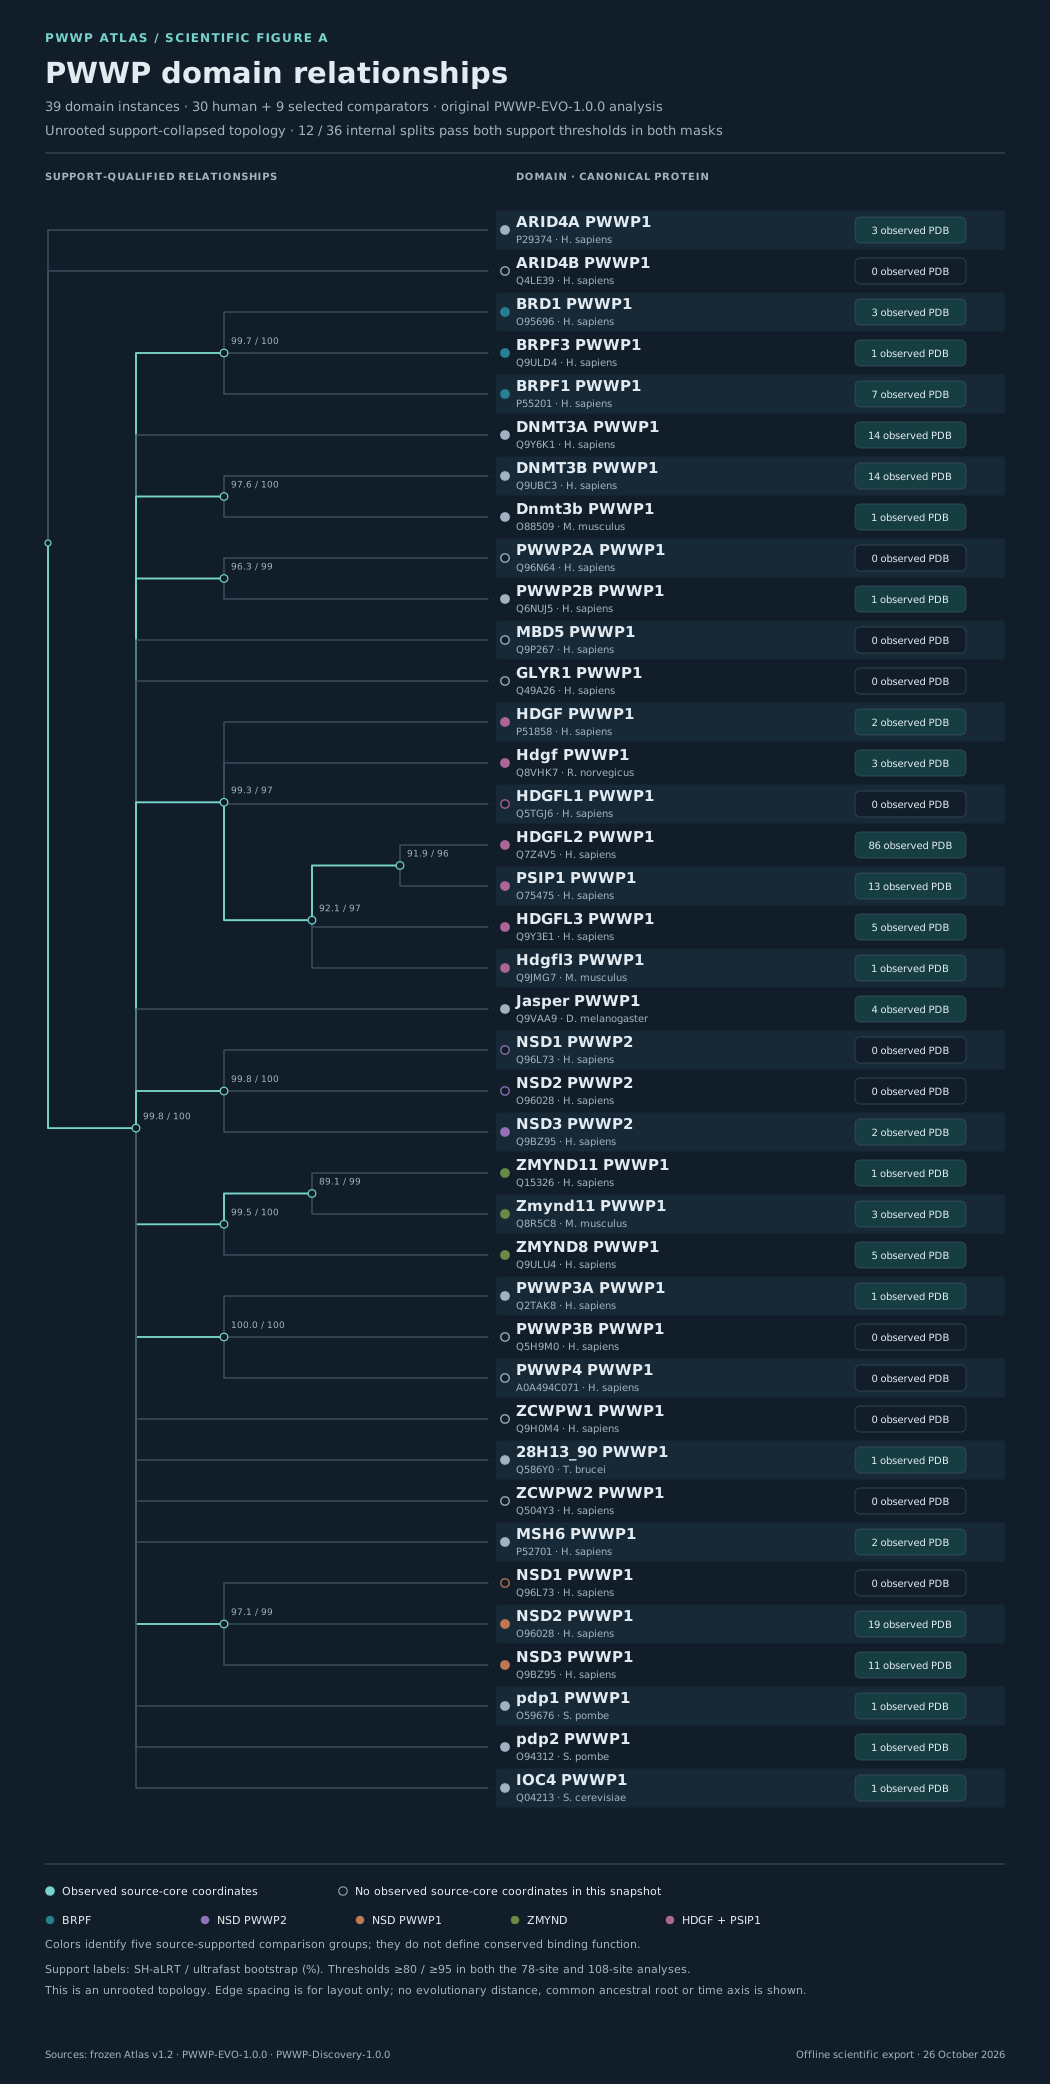
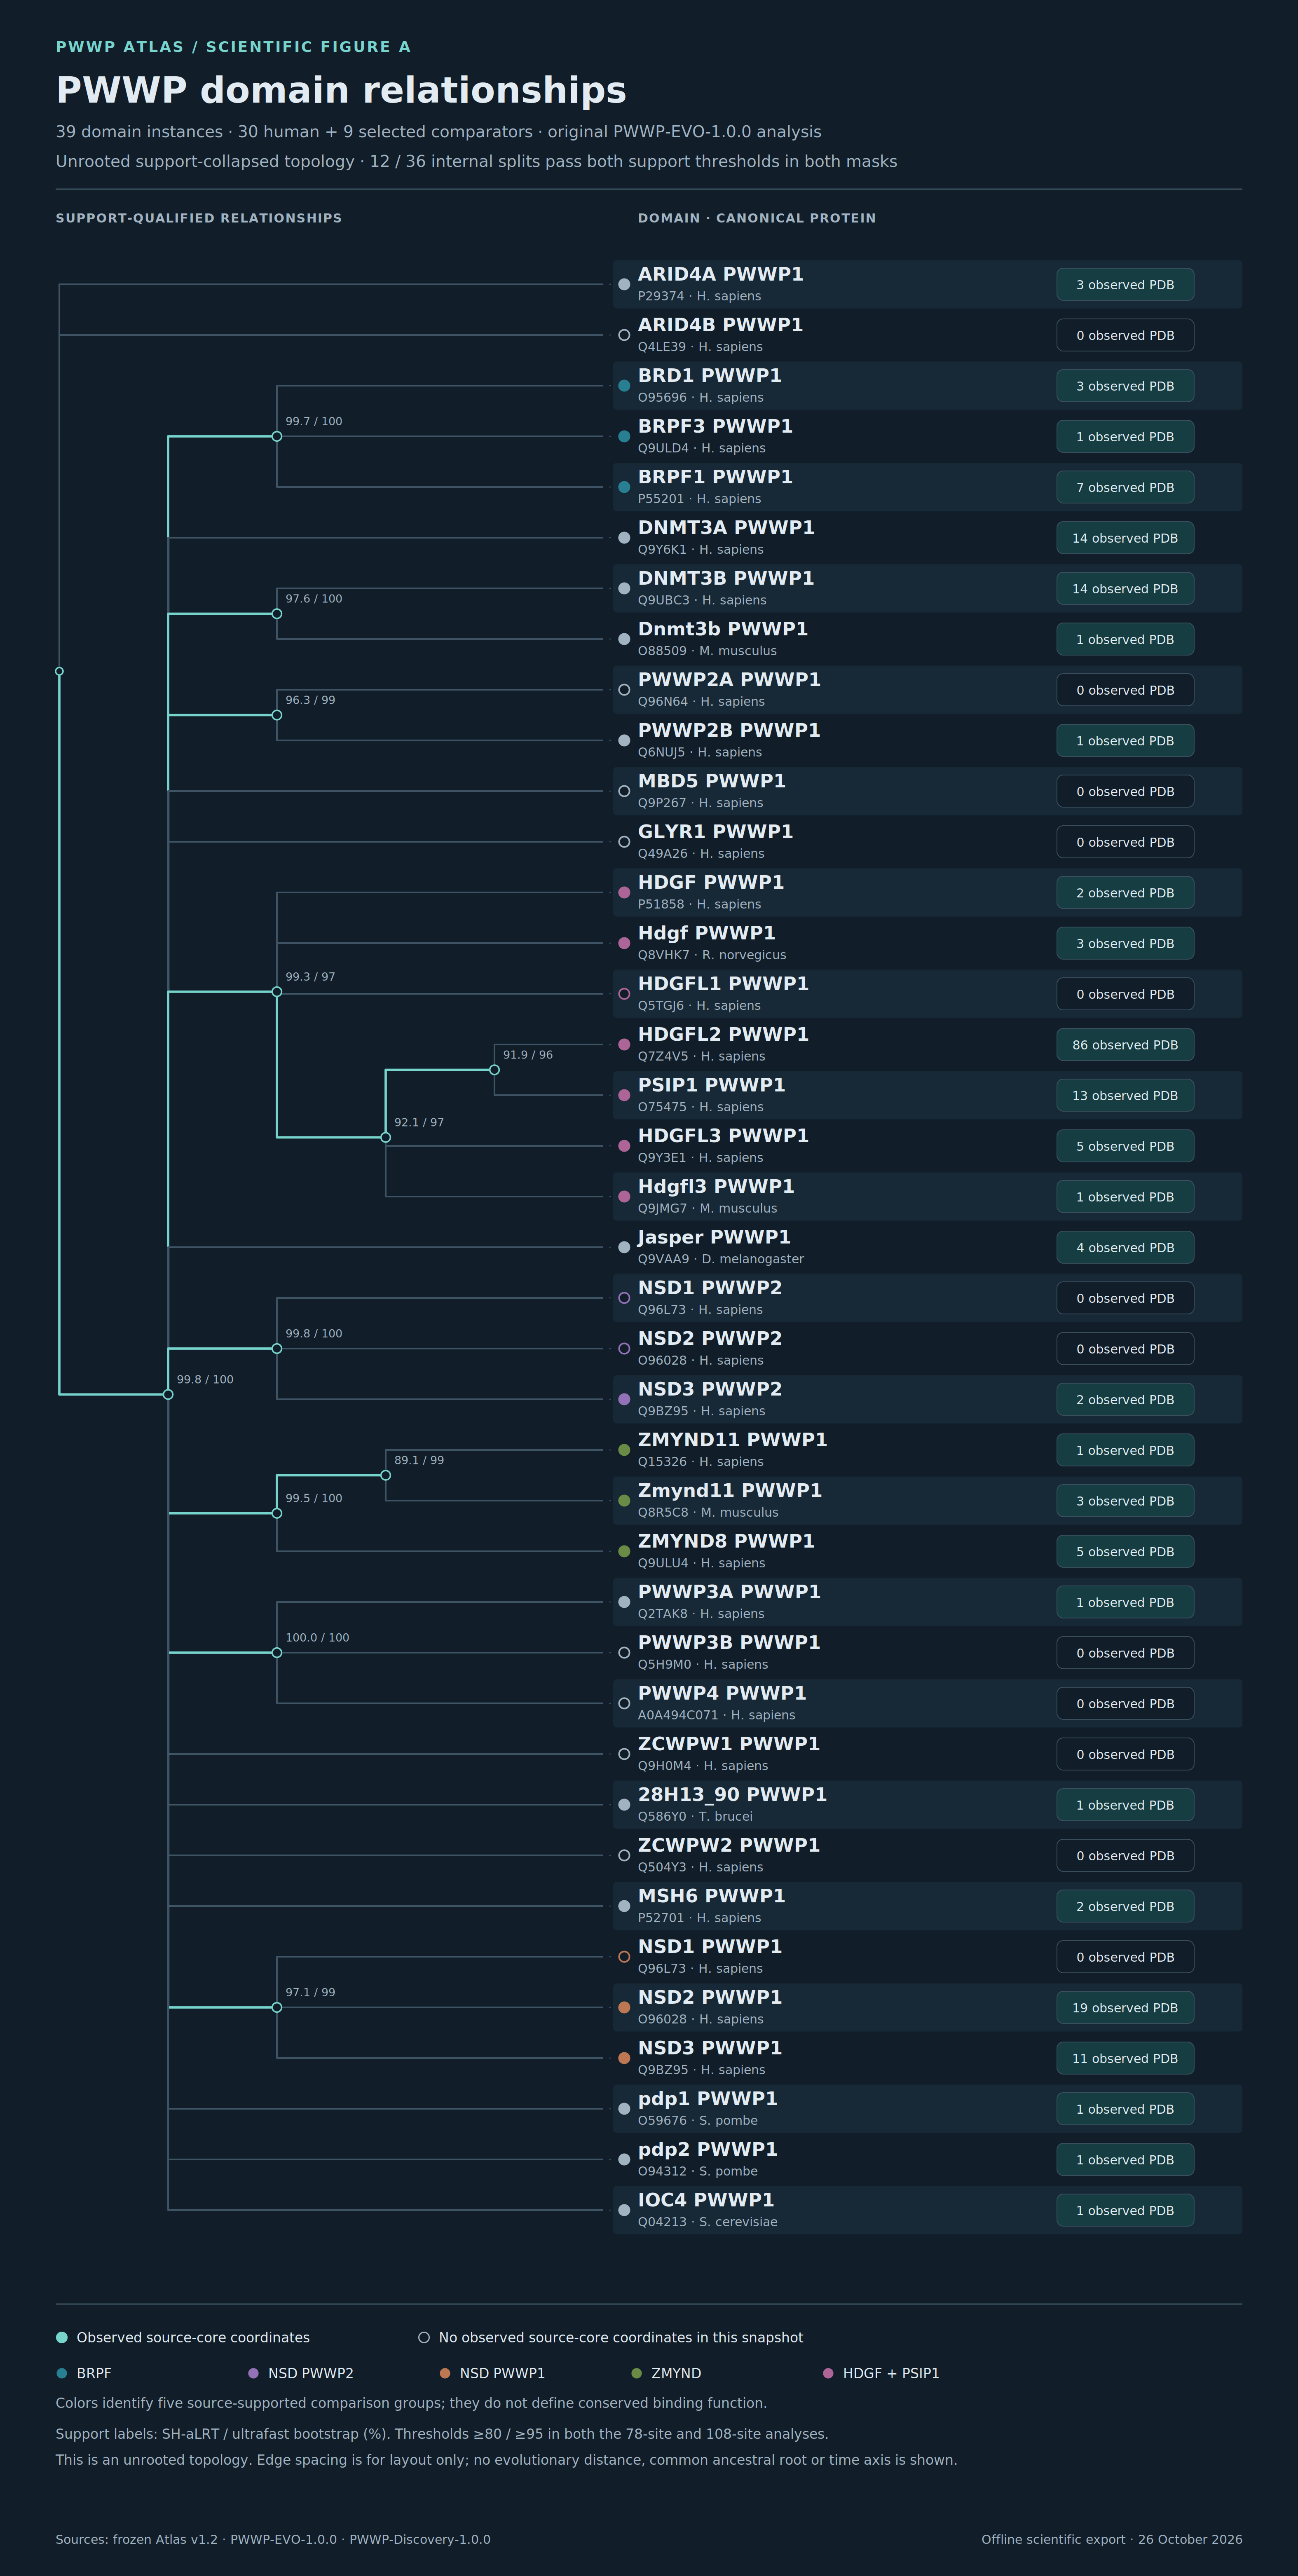
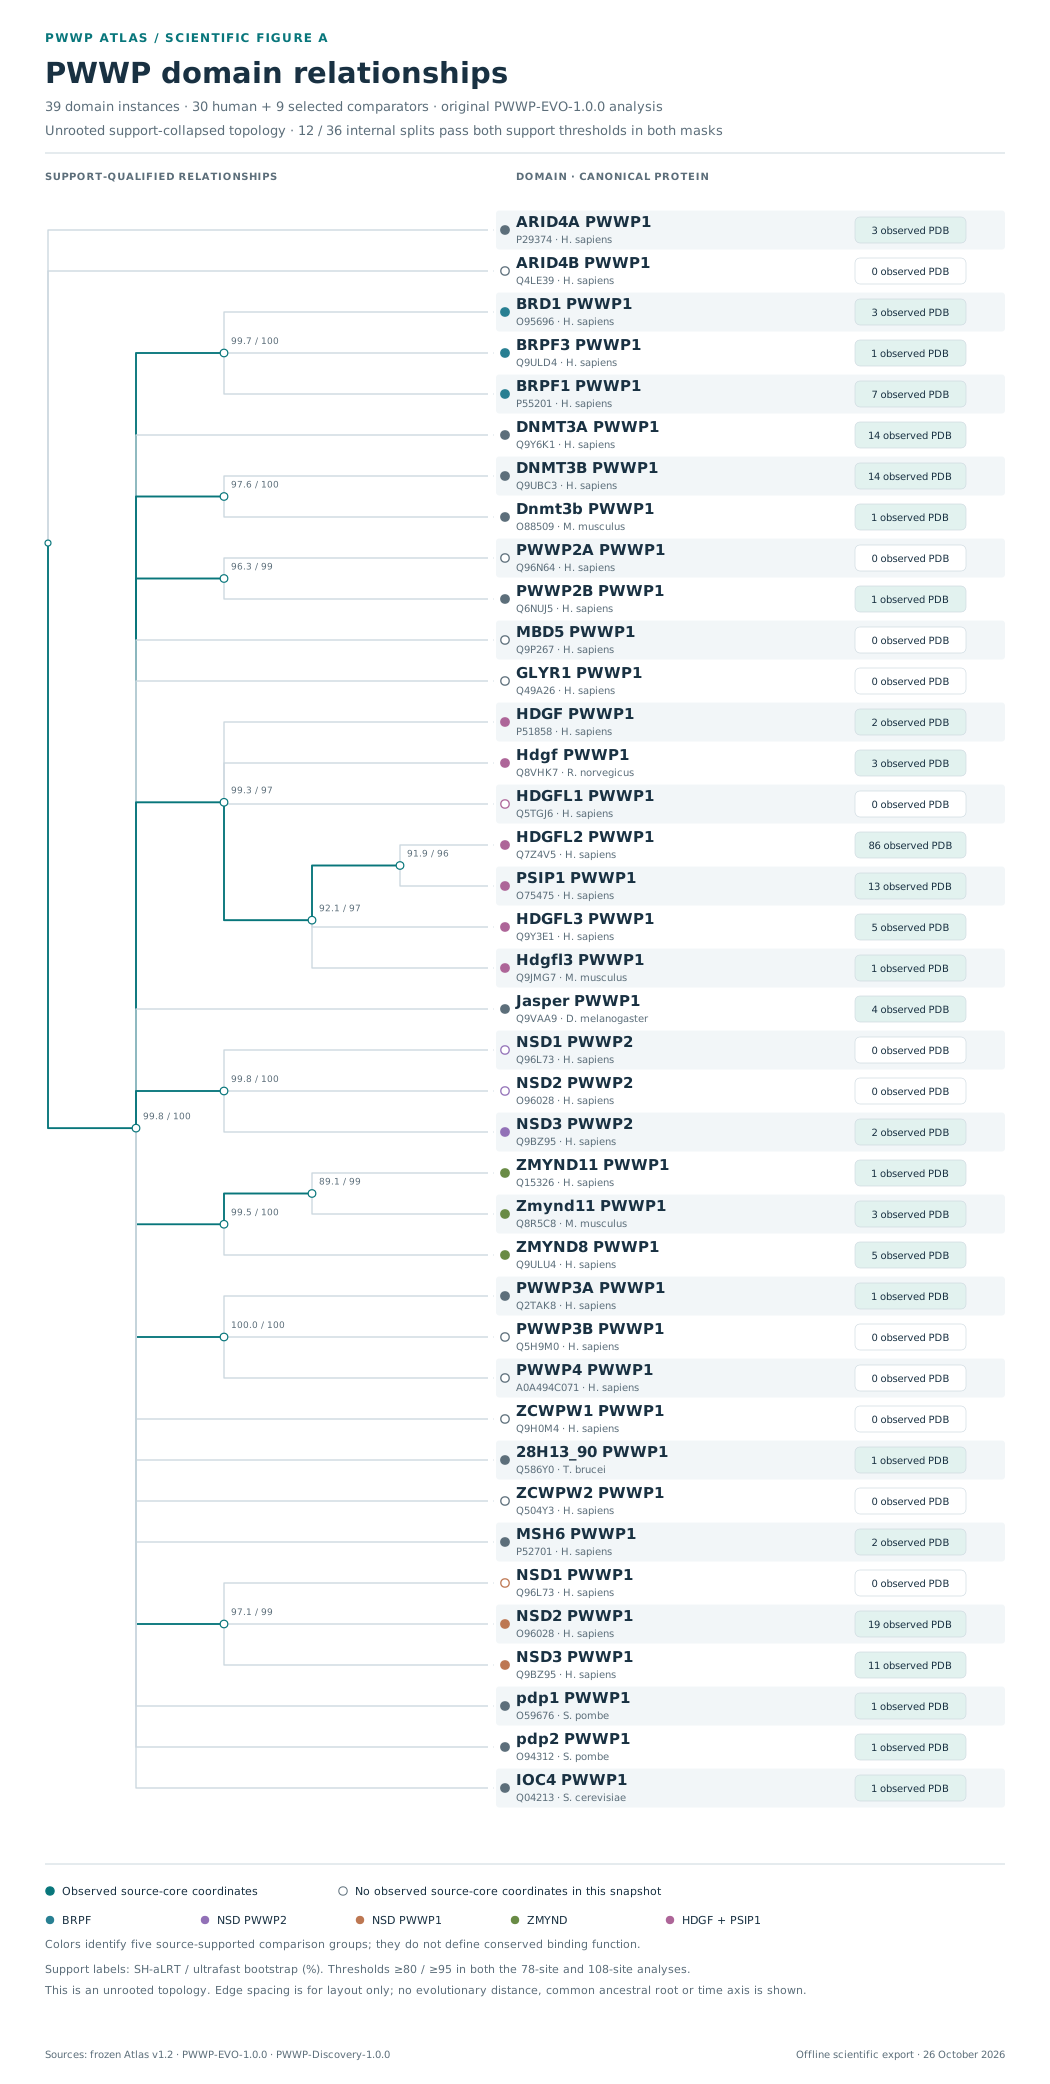
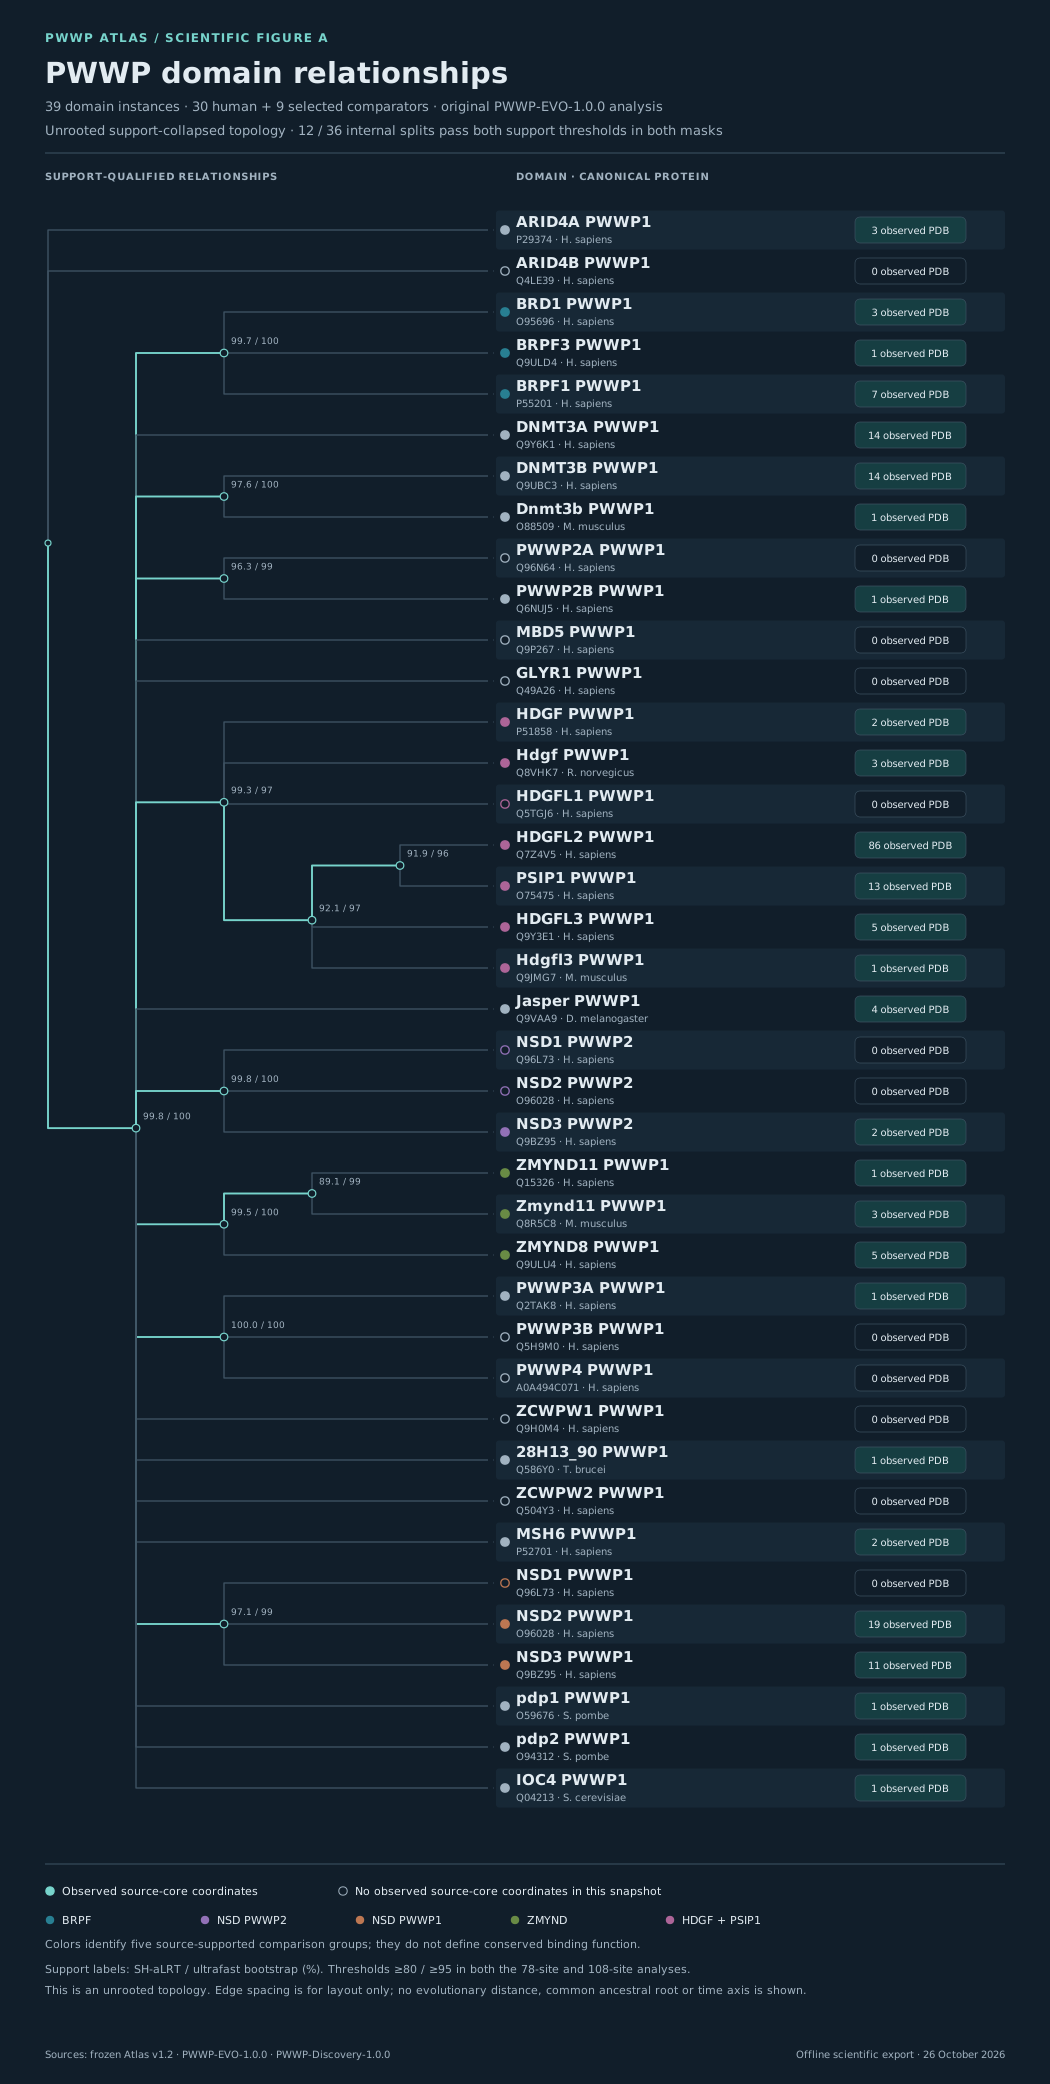
The original unrooted support-collapsed tree, with source branch support and observed-core structure counts.
Exact scientific data · reusable graphics
Six linked views of PWWP evolution, architecture, residues, structures and chemical evidence. Inspect a figure, then take its source-linked SVG or high-resolution PNG.
The preview follows the website's color theme. Open the full SVG to inspect fine labels. Every SVG and 3× PNG is checked against the figure manifest before it is served.
Figure A
The original unrooted support-collapsed tree, with source branch support and observed-core structure counts.
Figure B
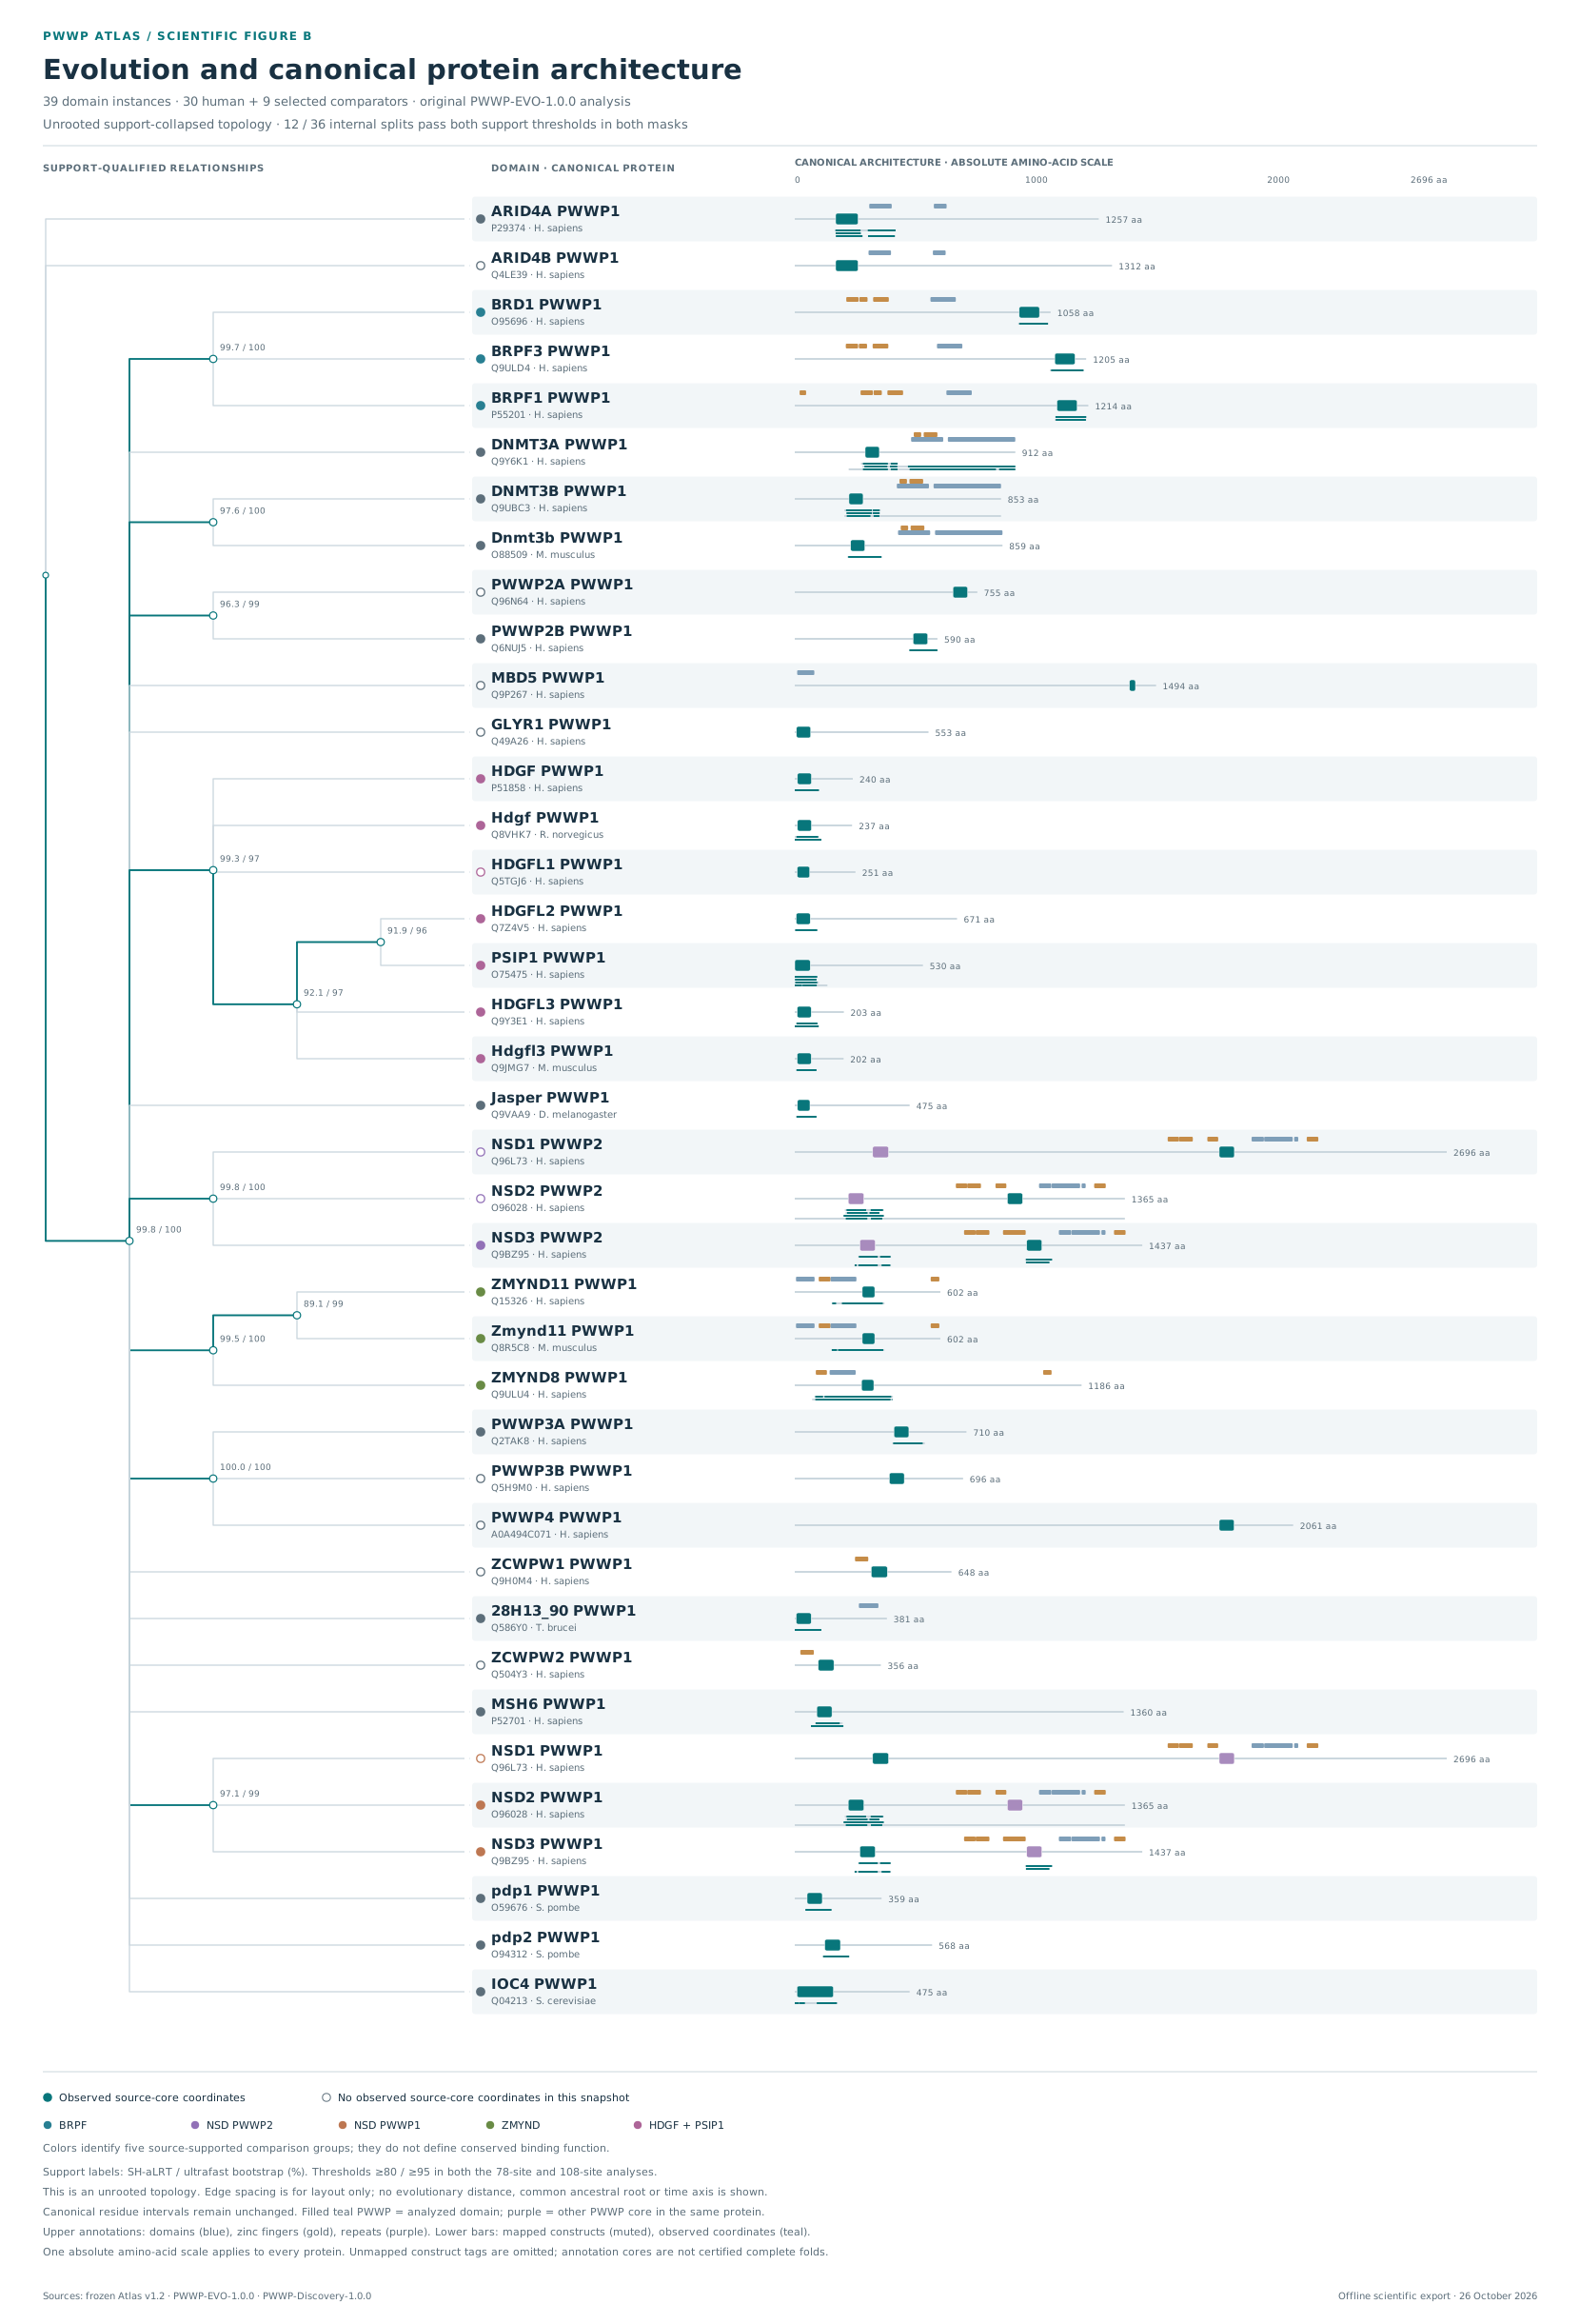
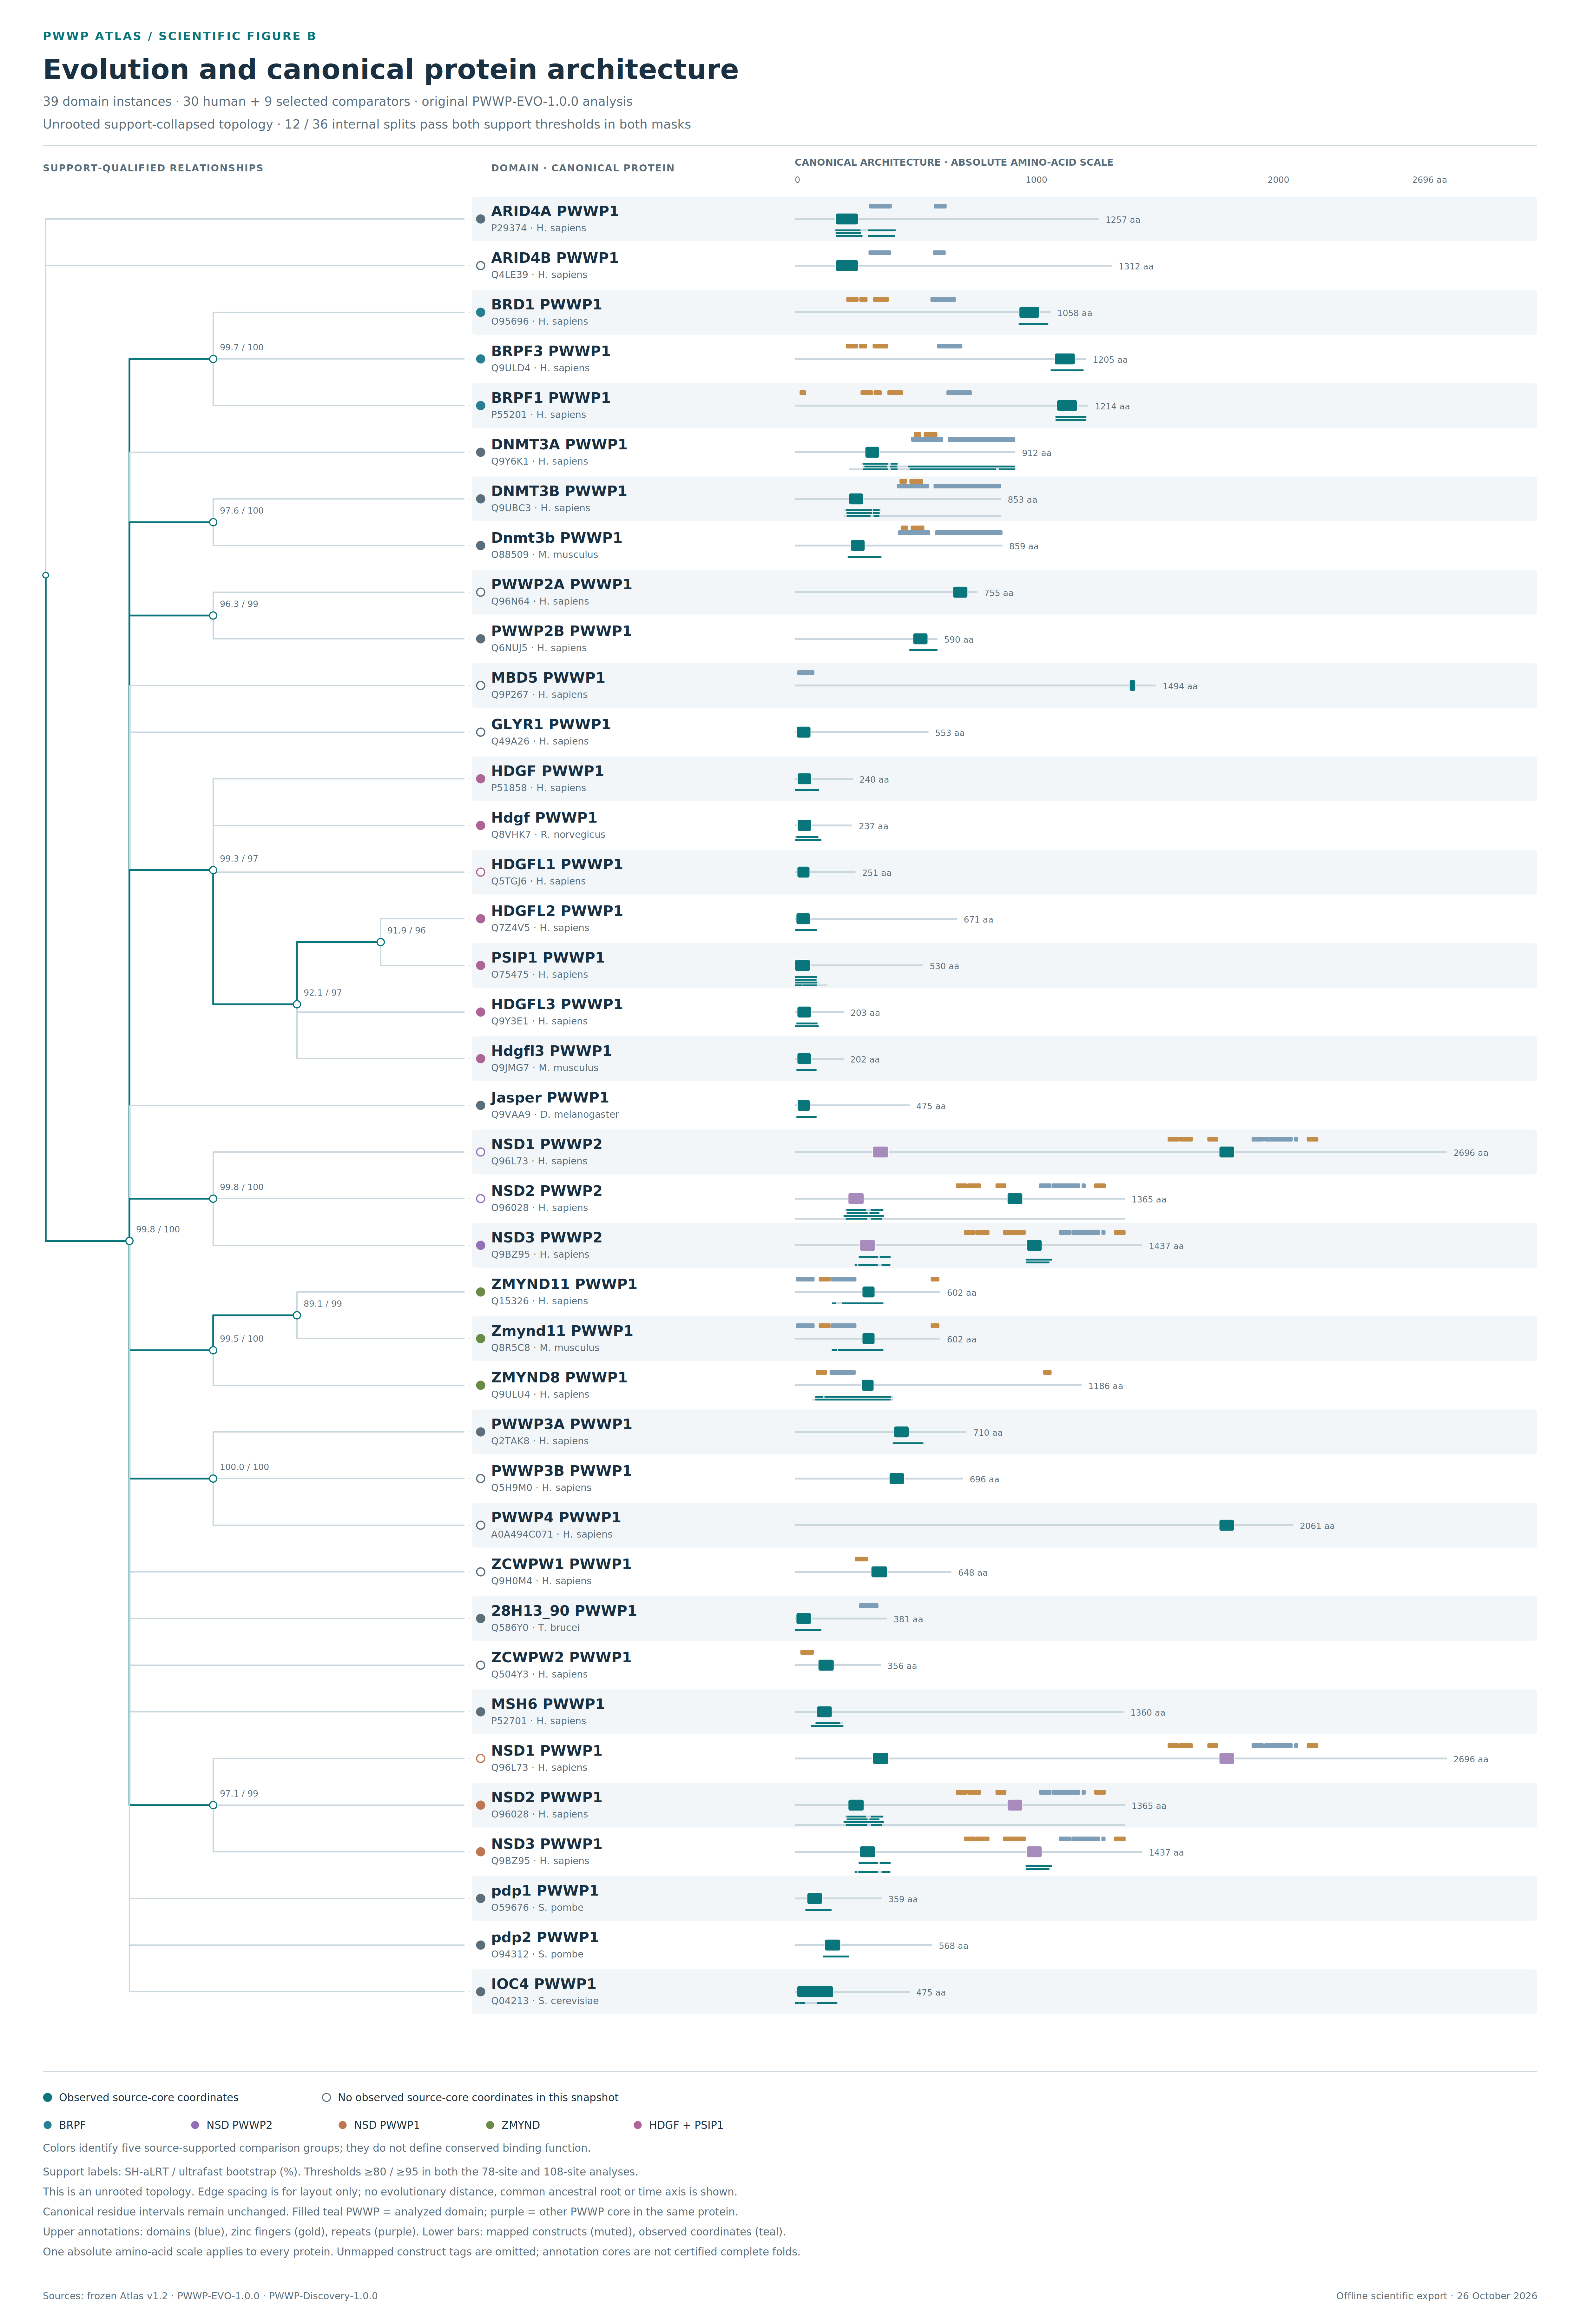
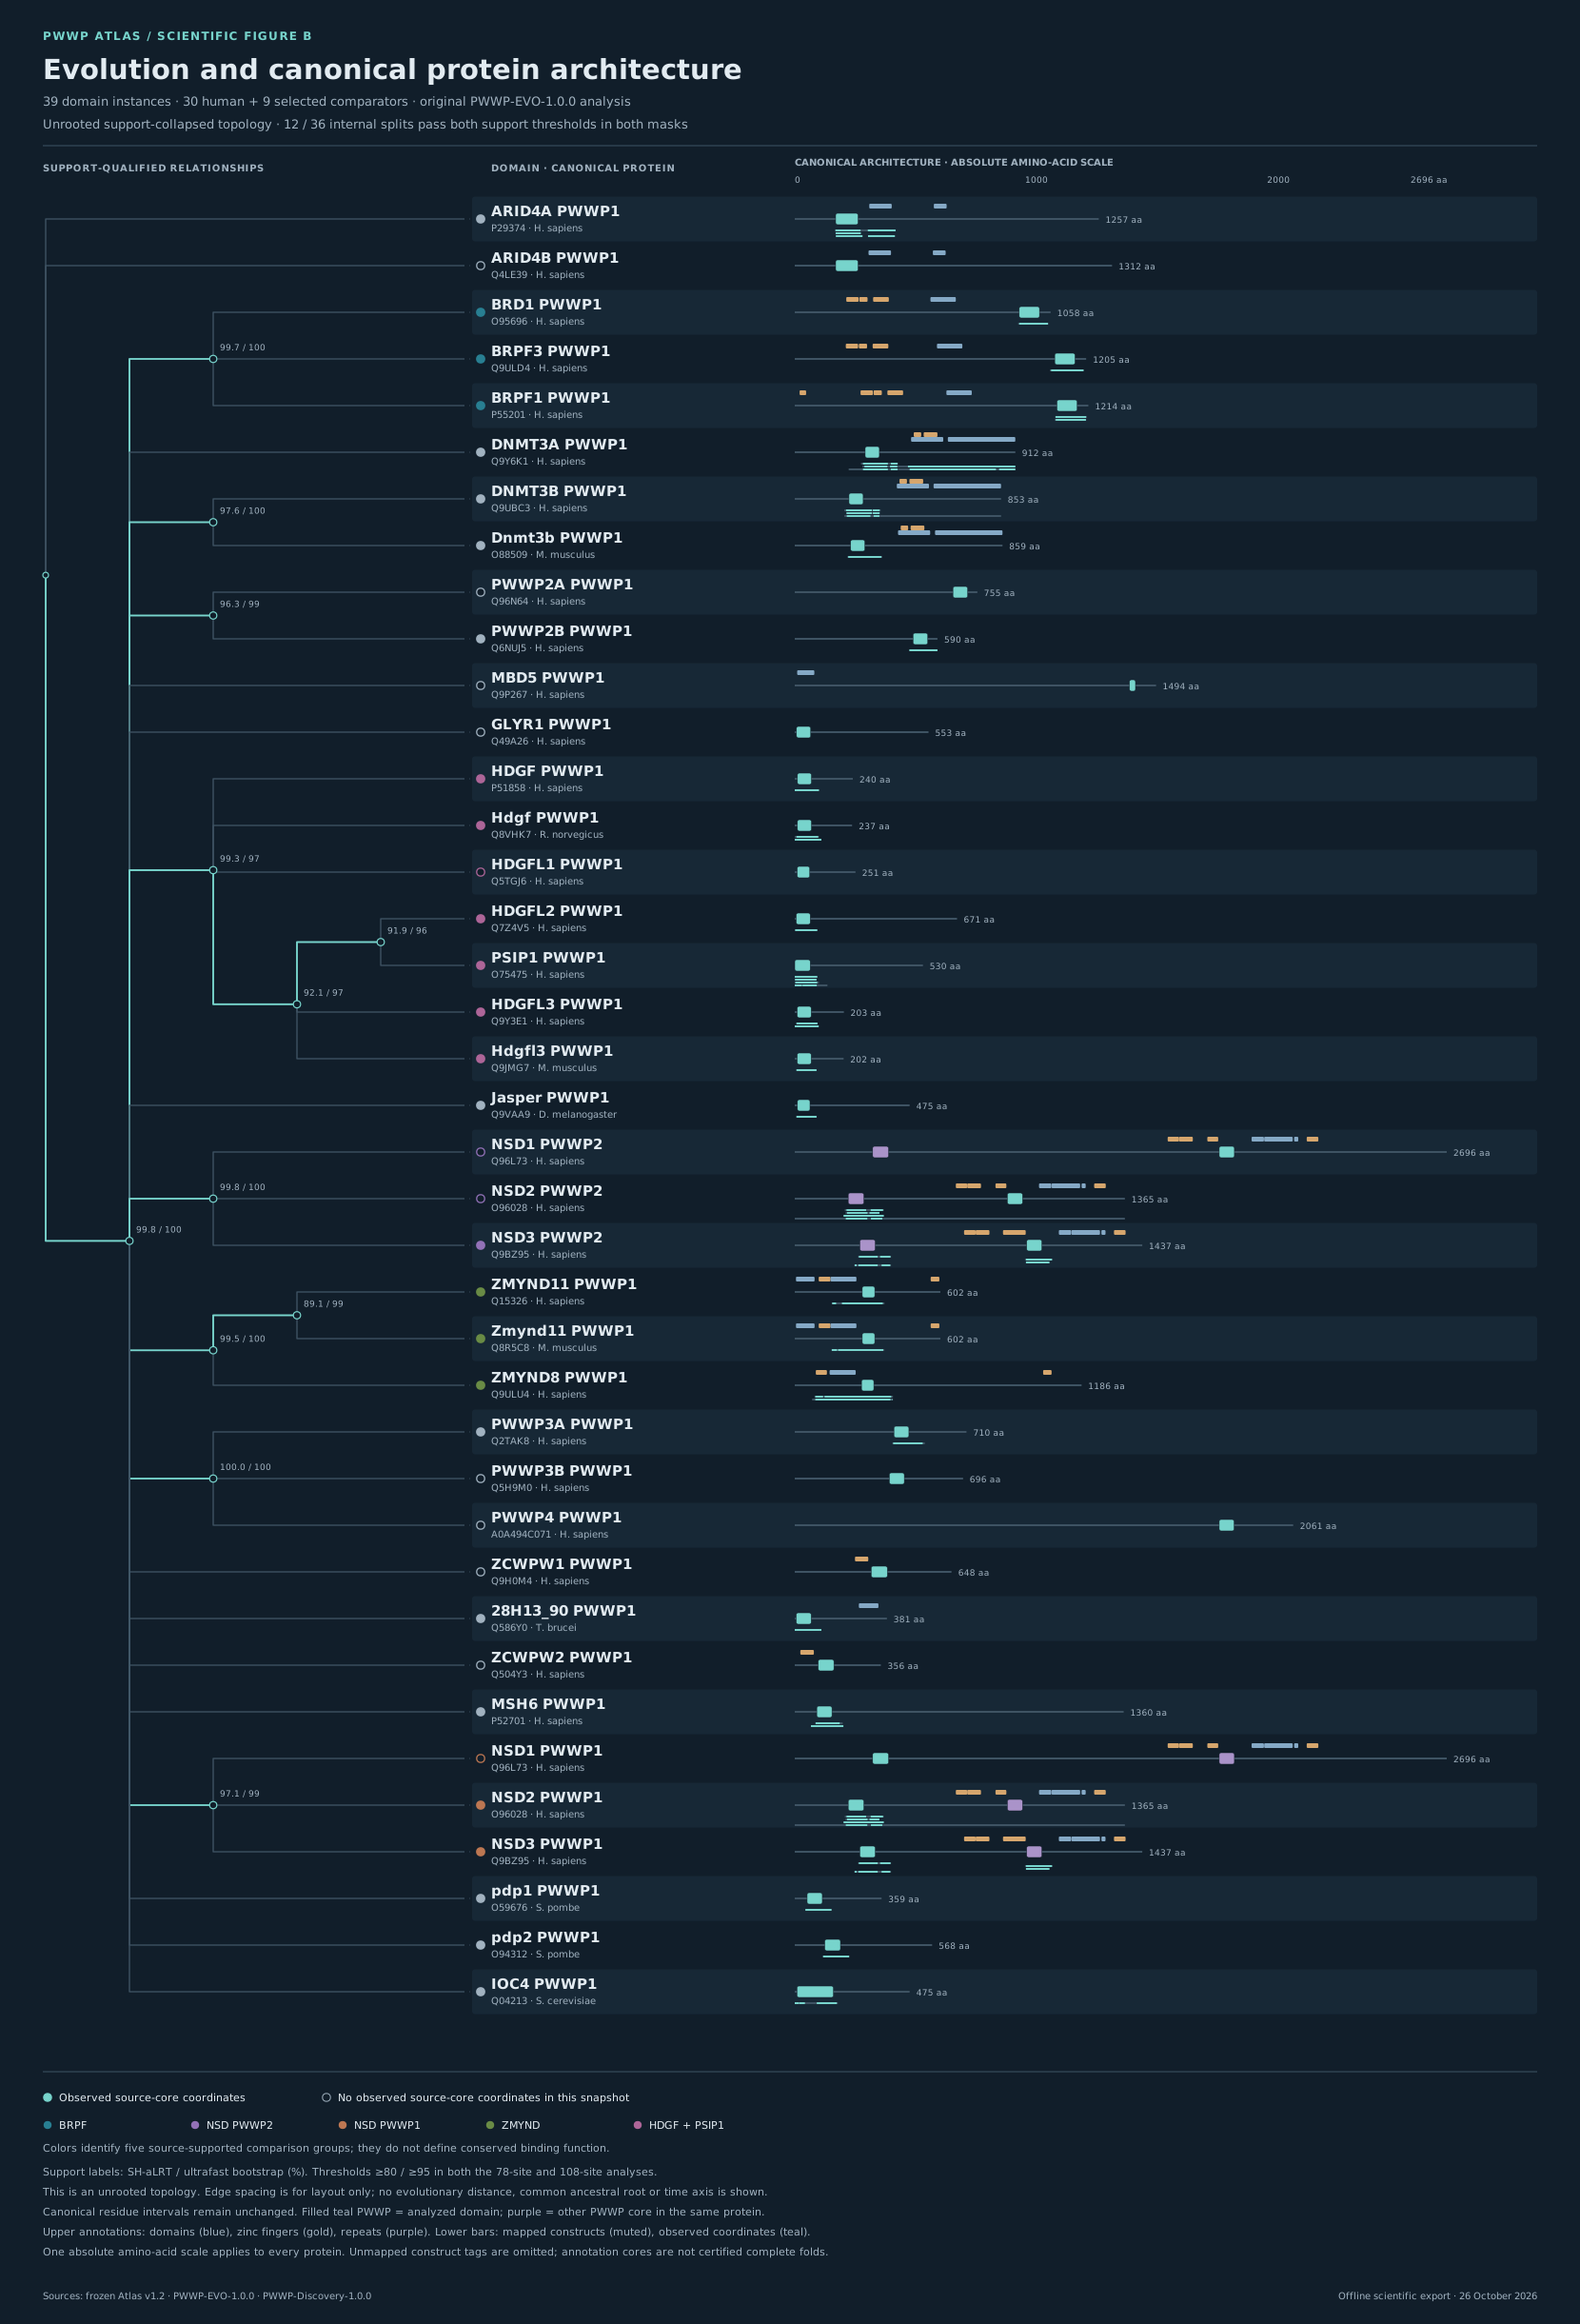
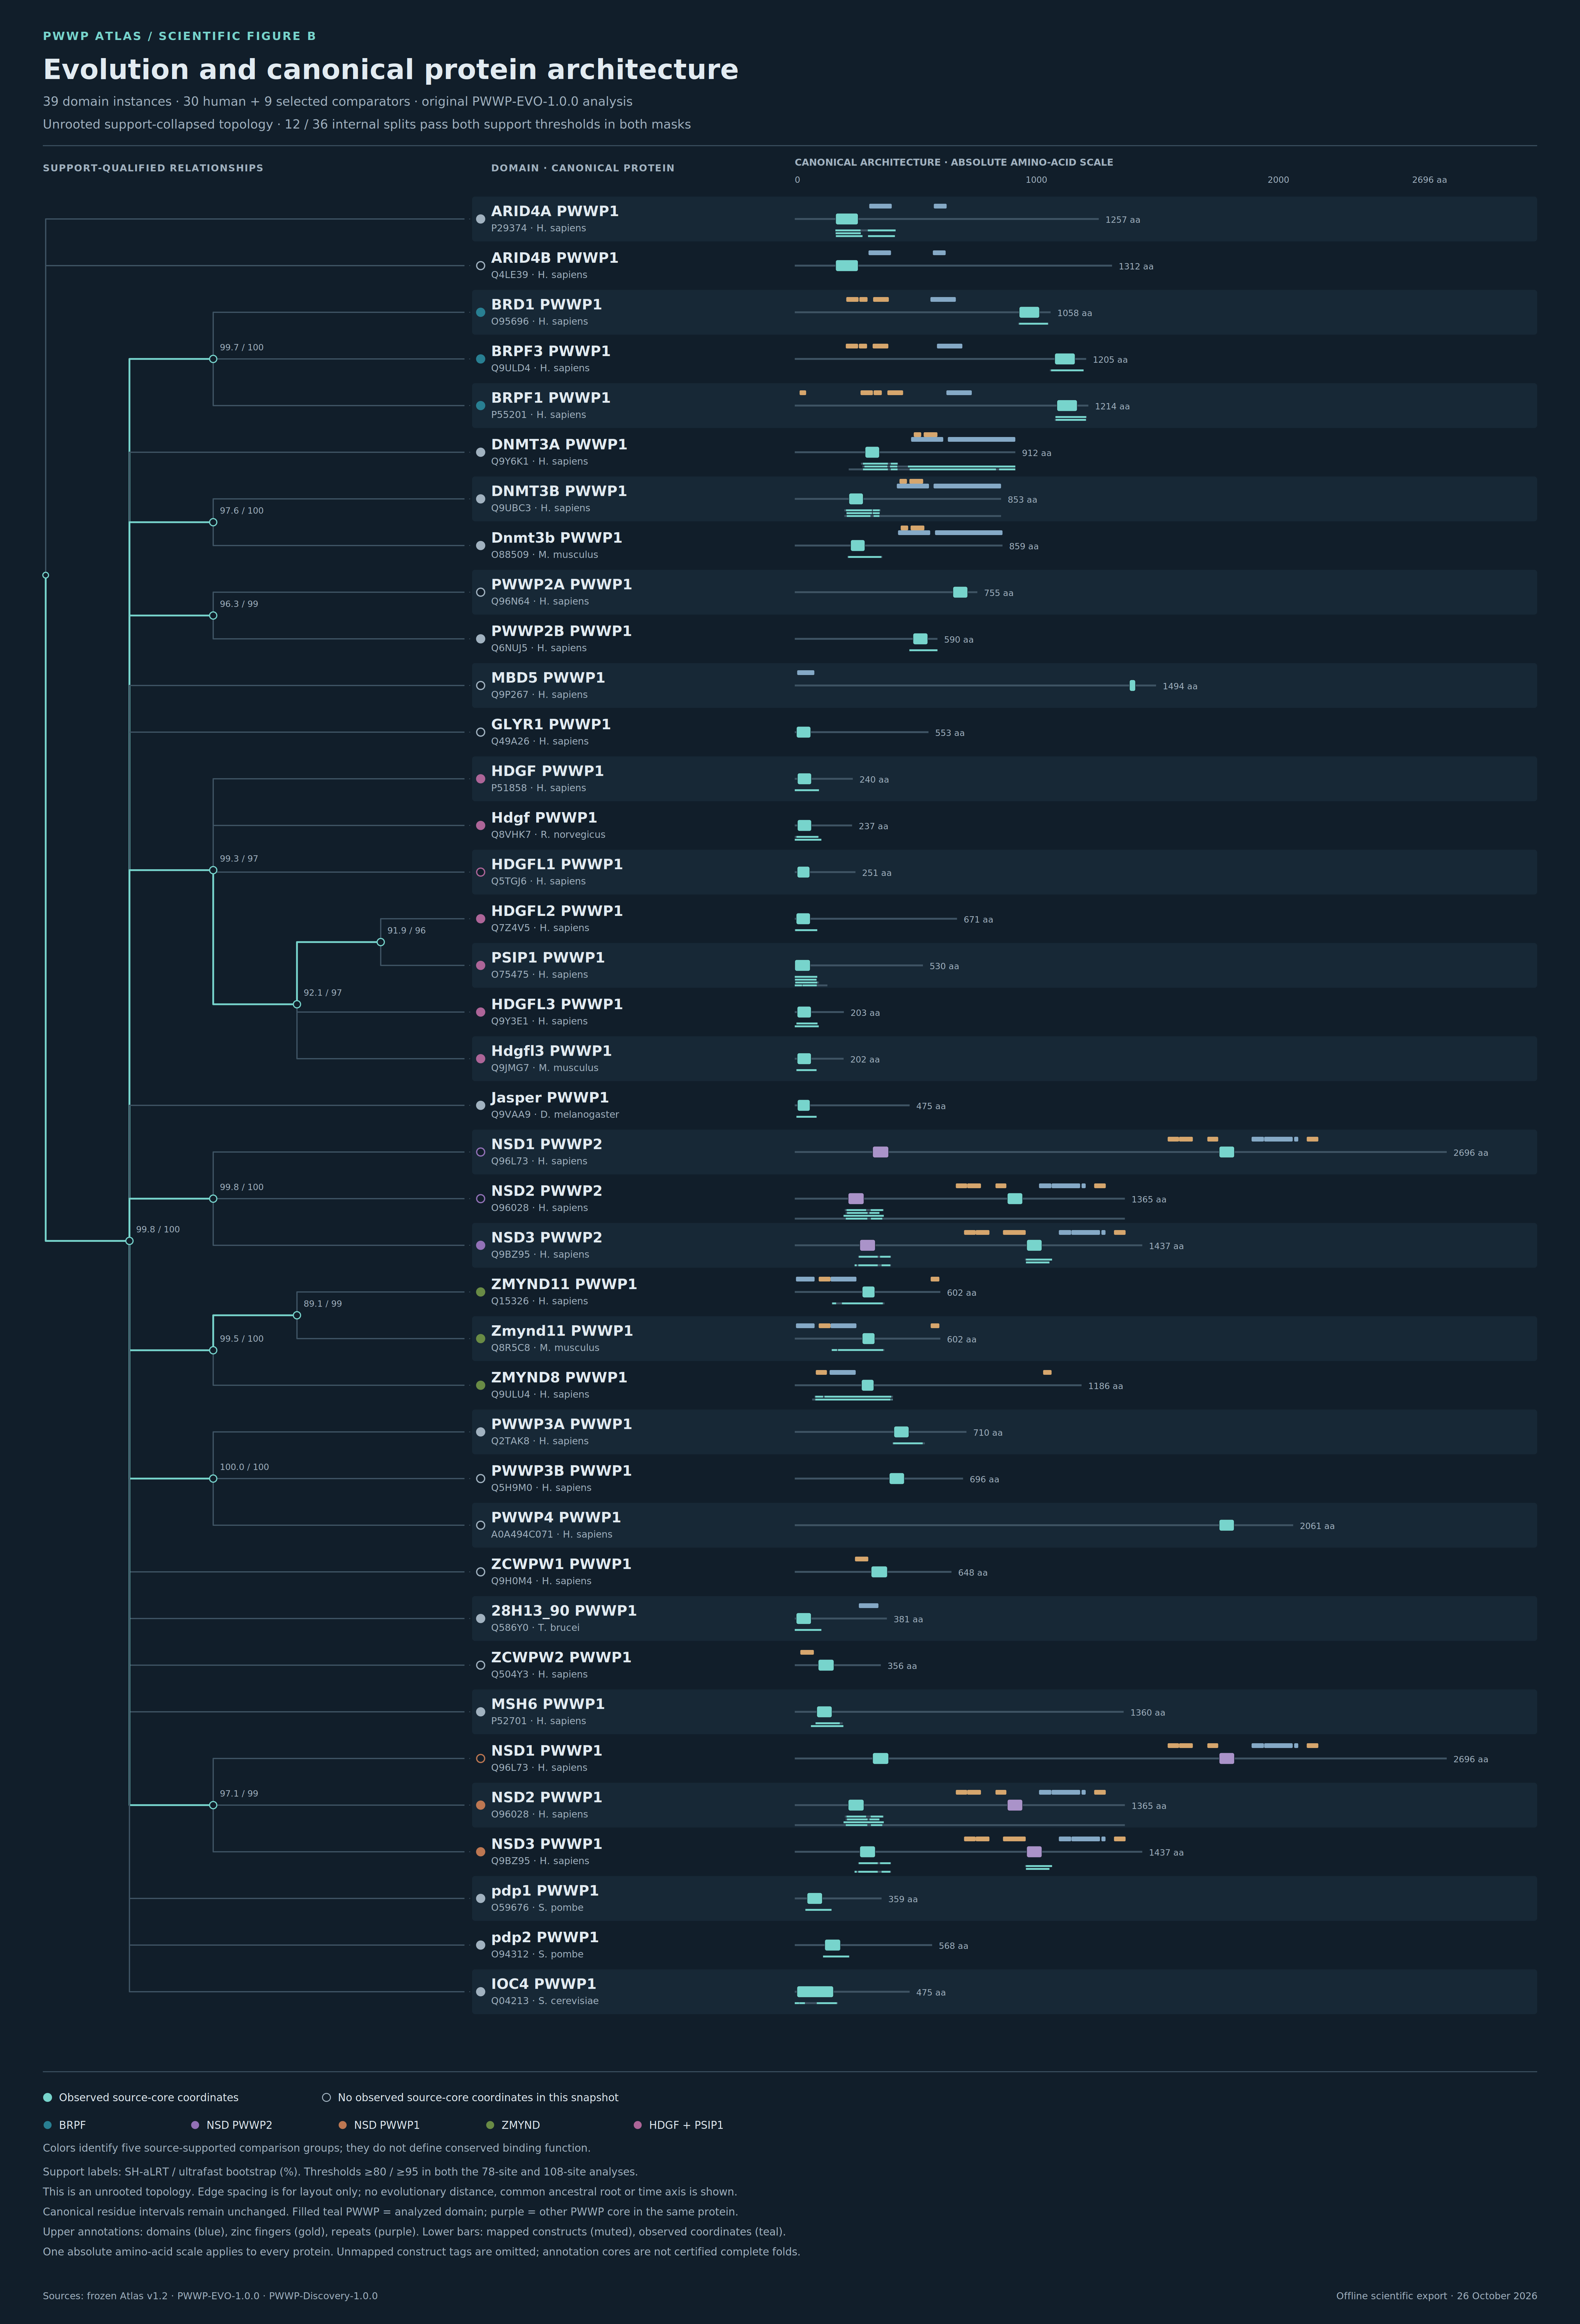
The same domain tips aligned with canonical protein architecture, analyzed cores and selected construct intervals.
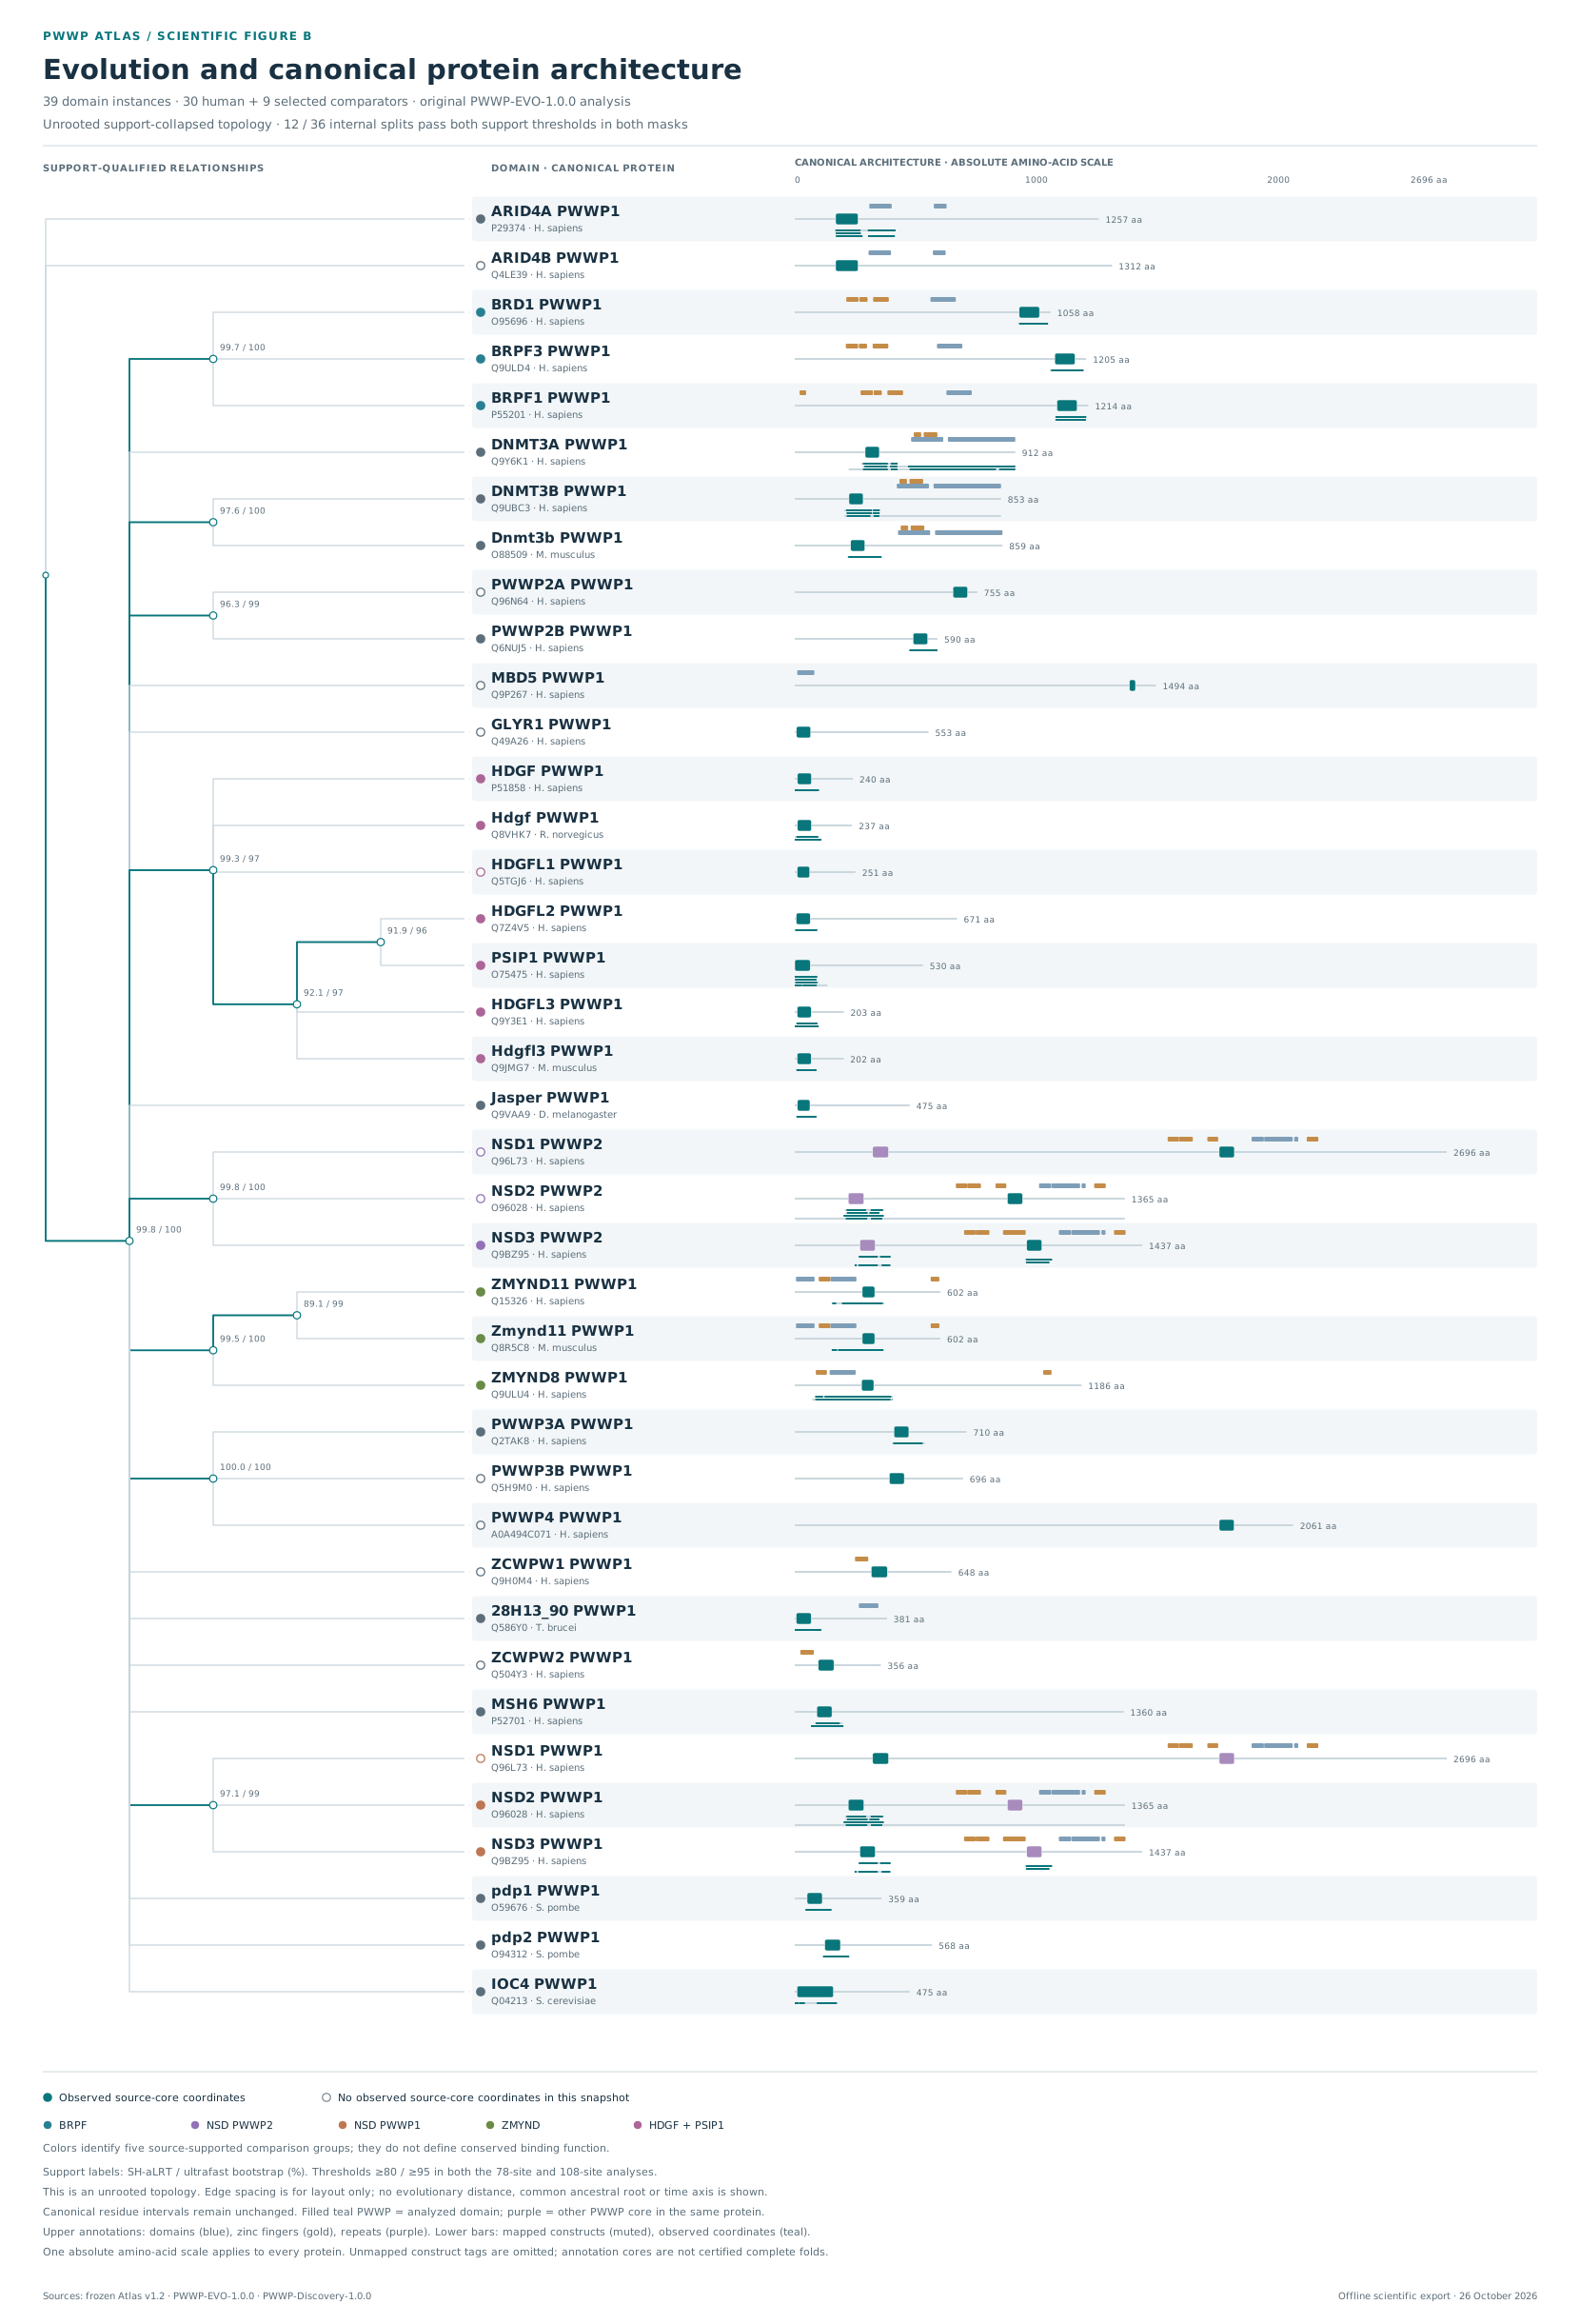
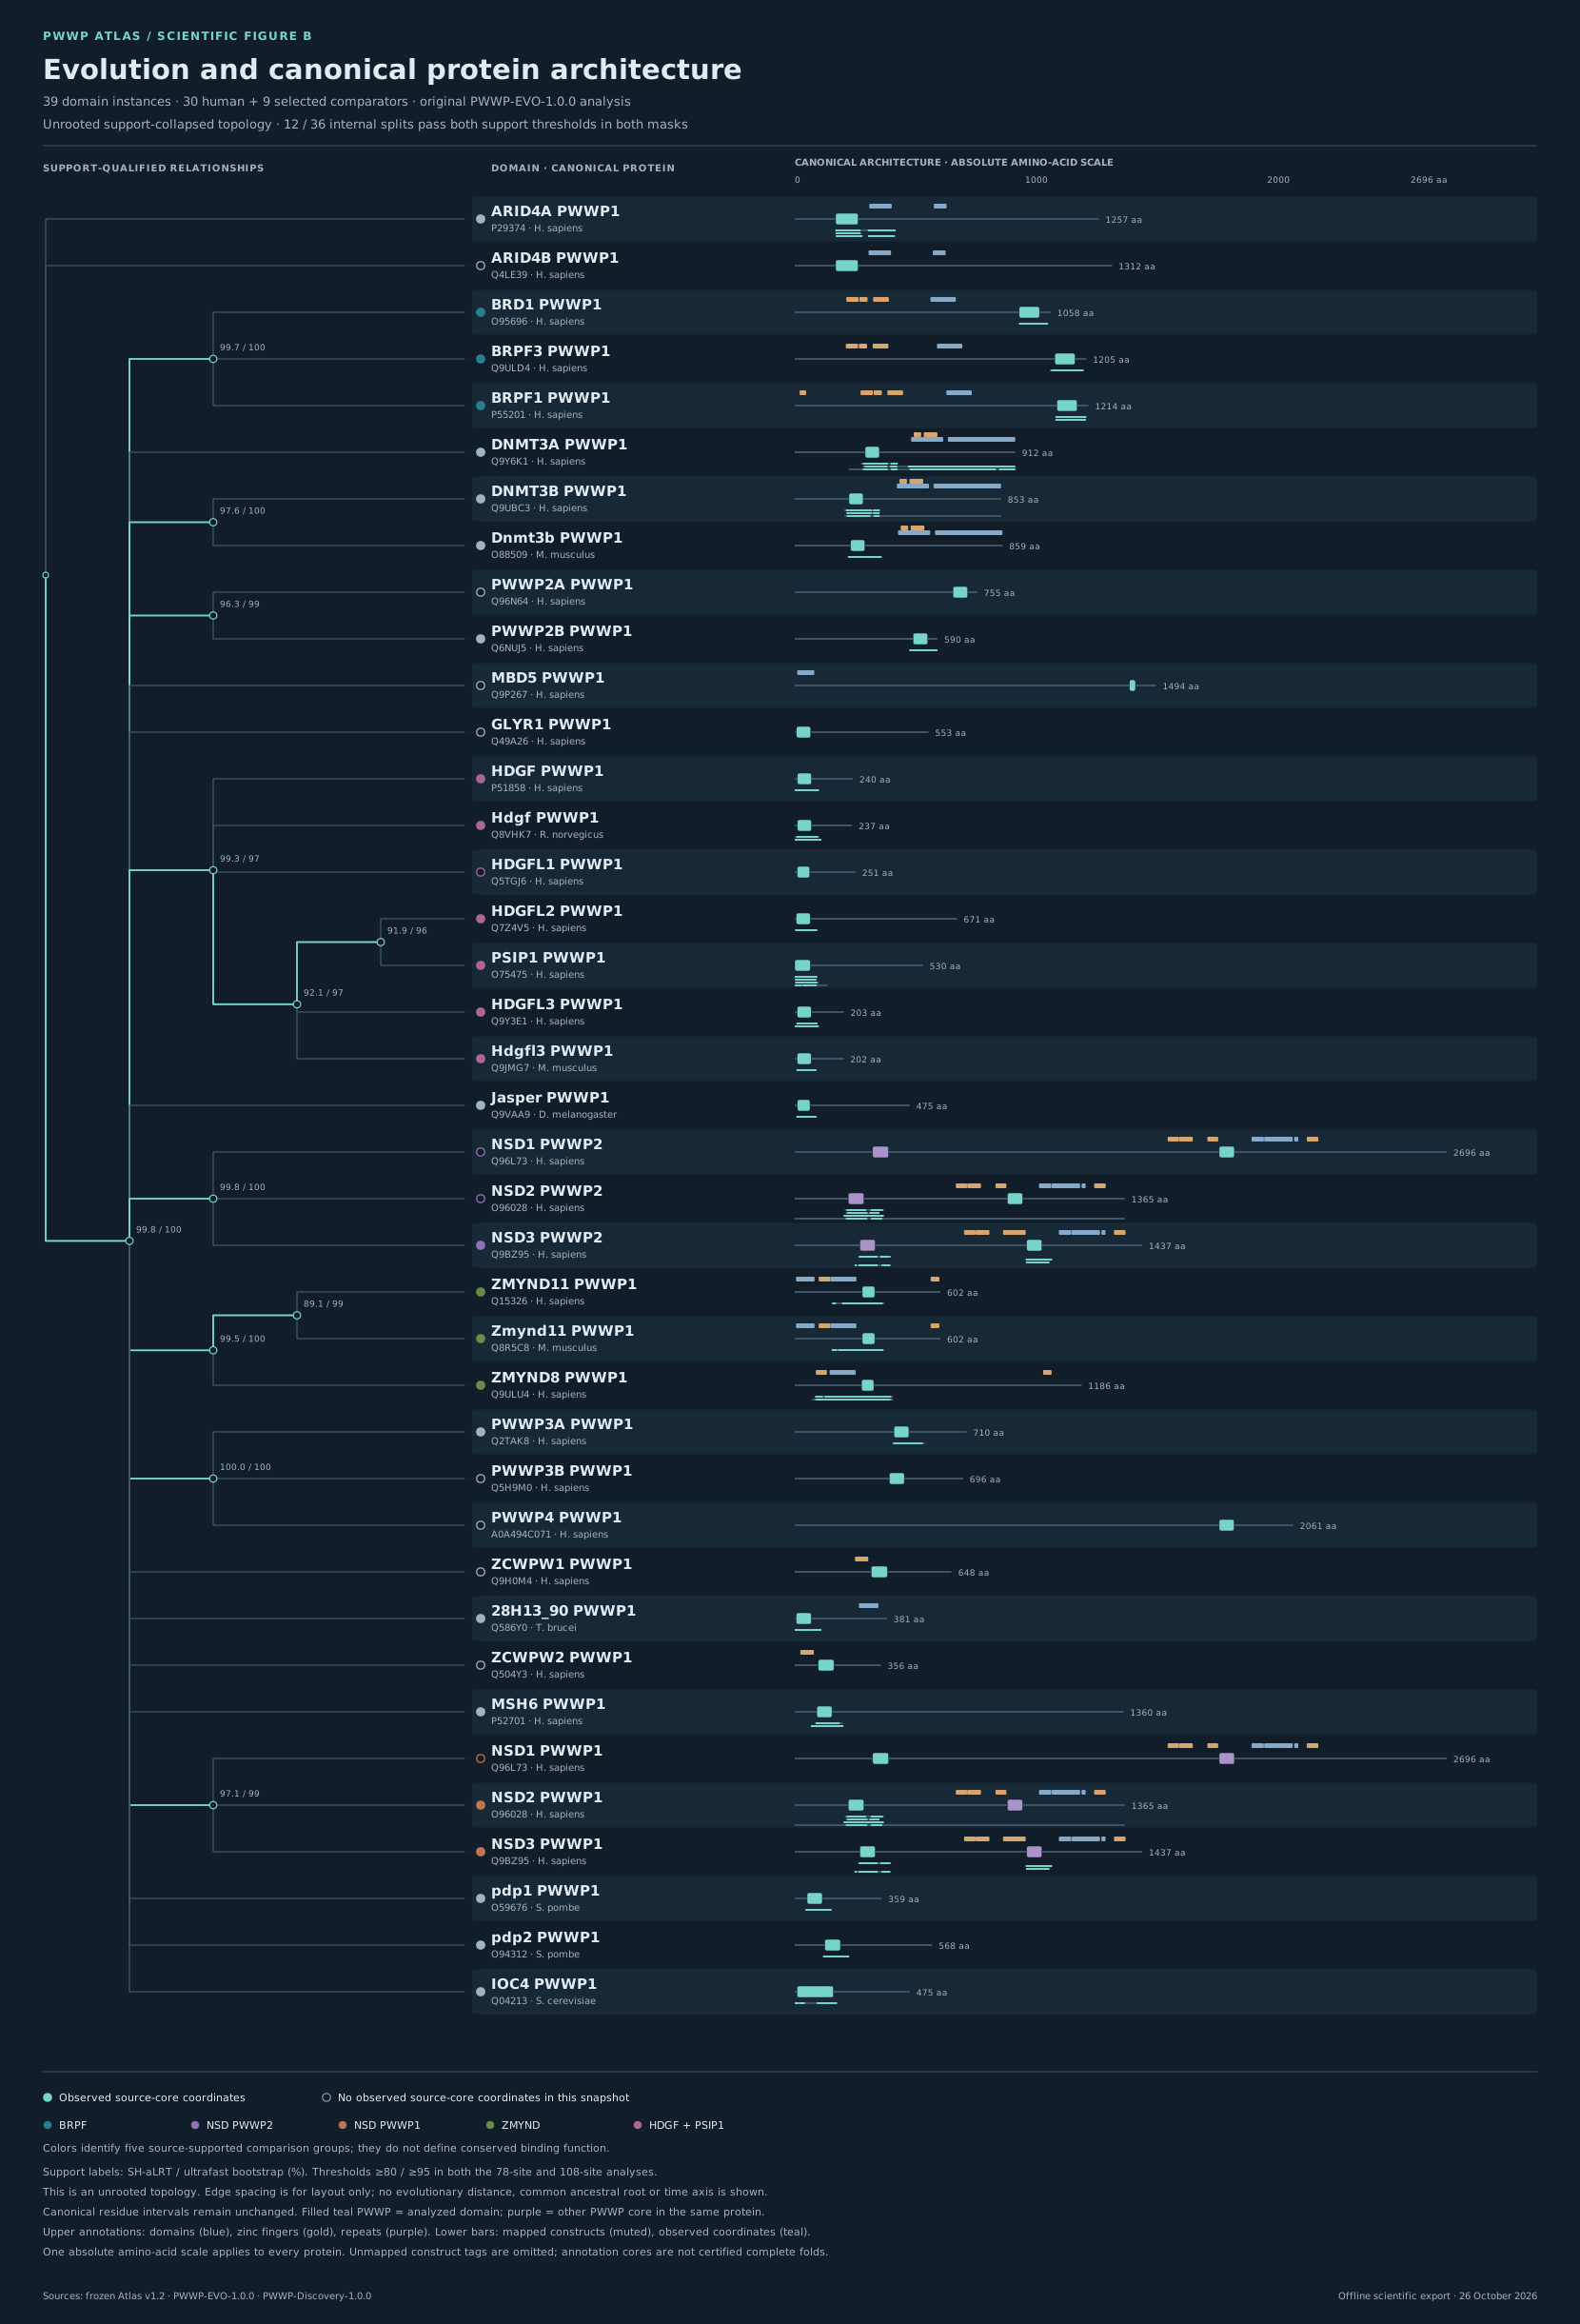
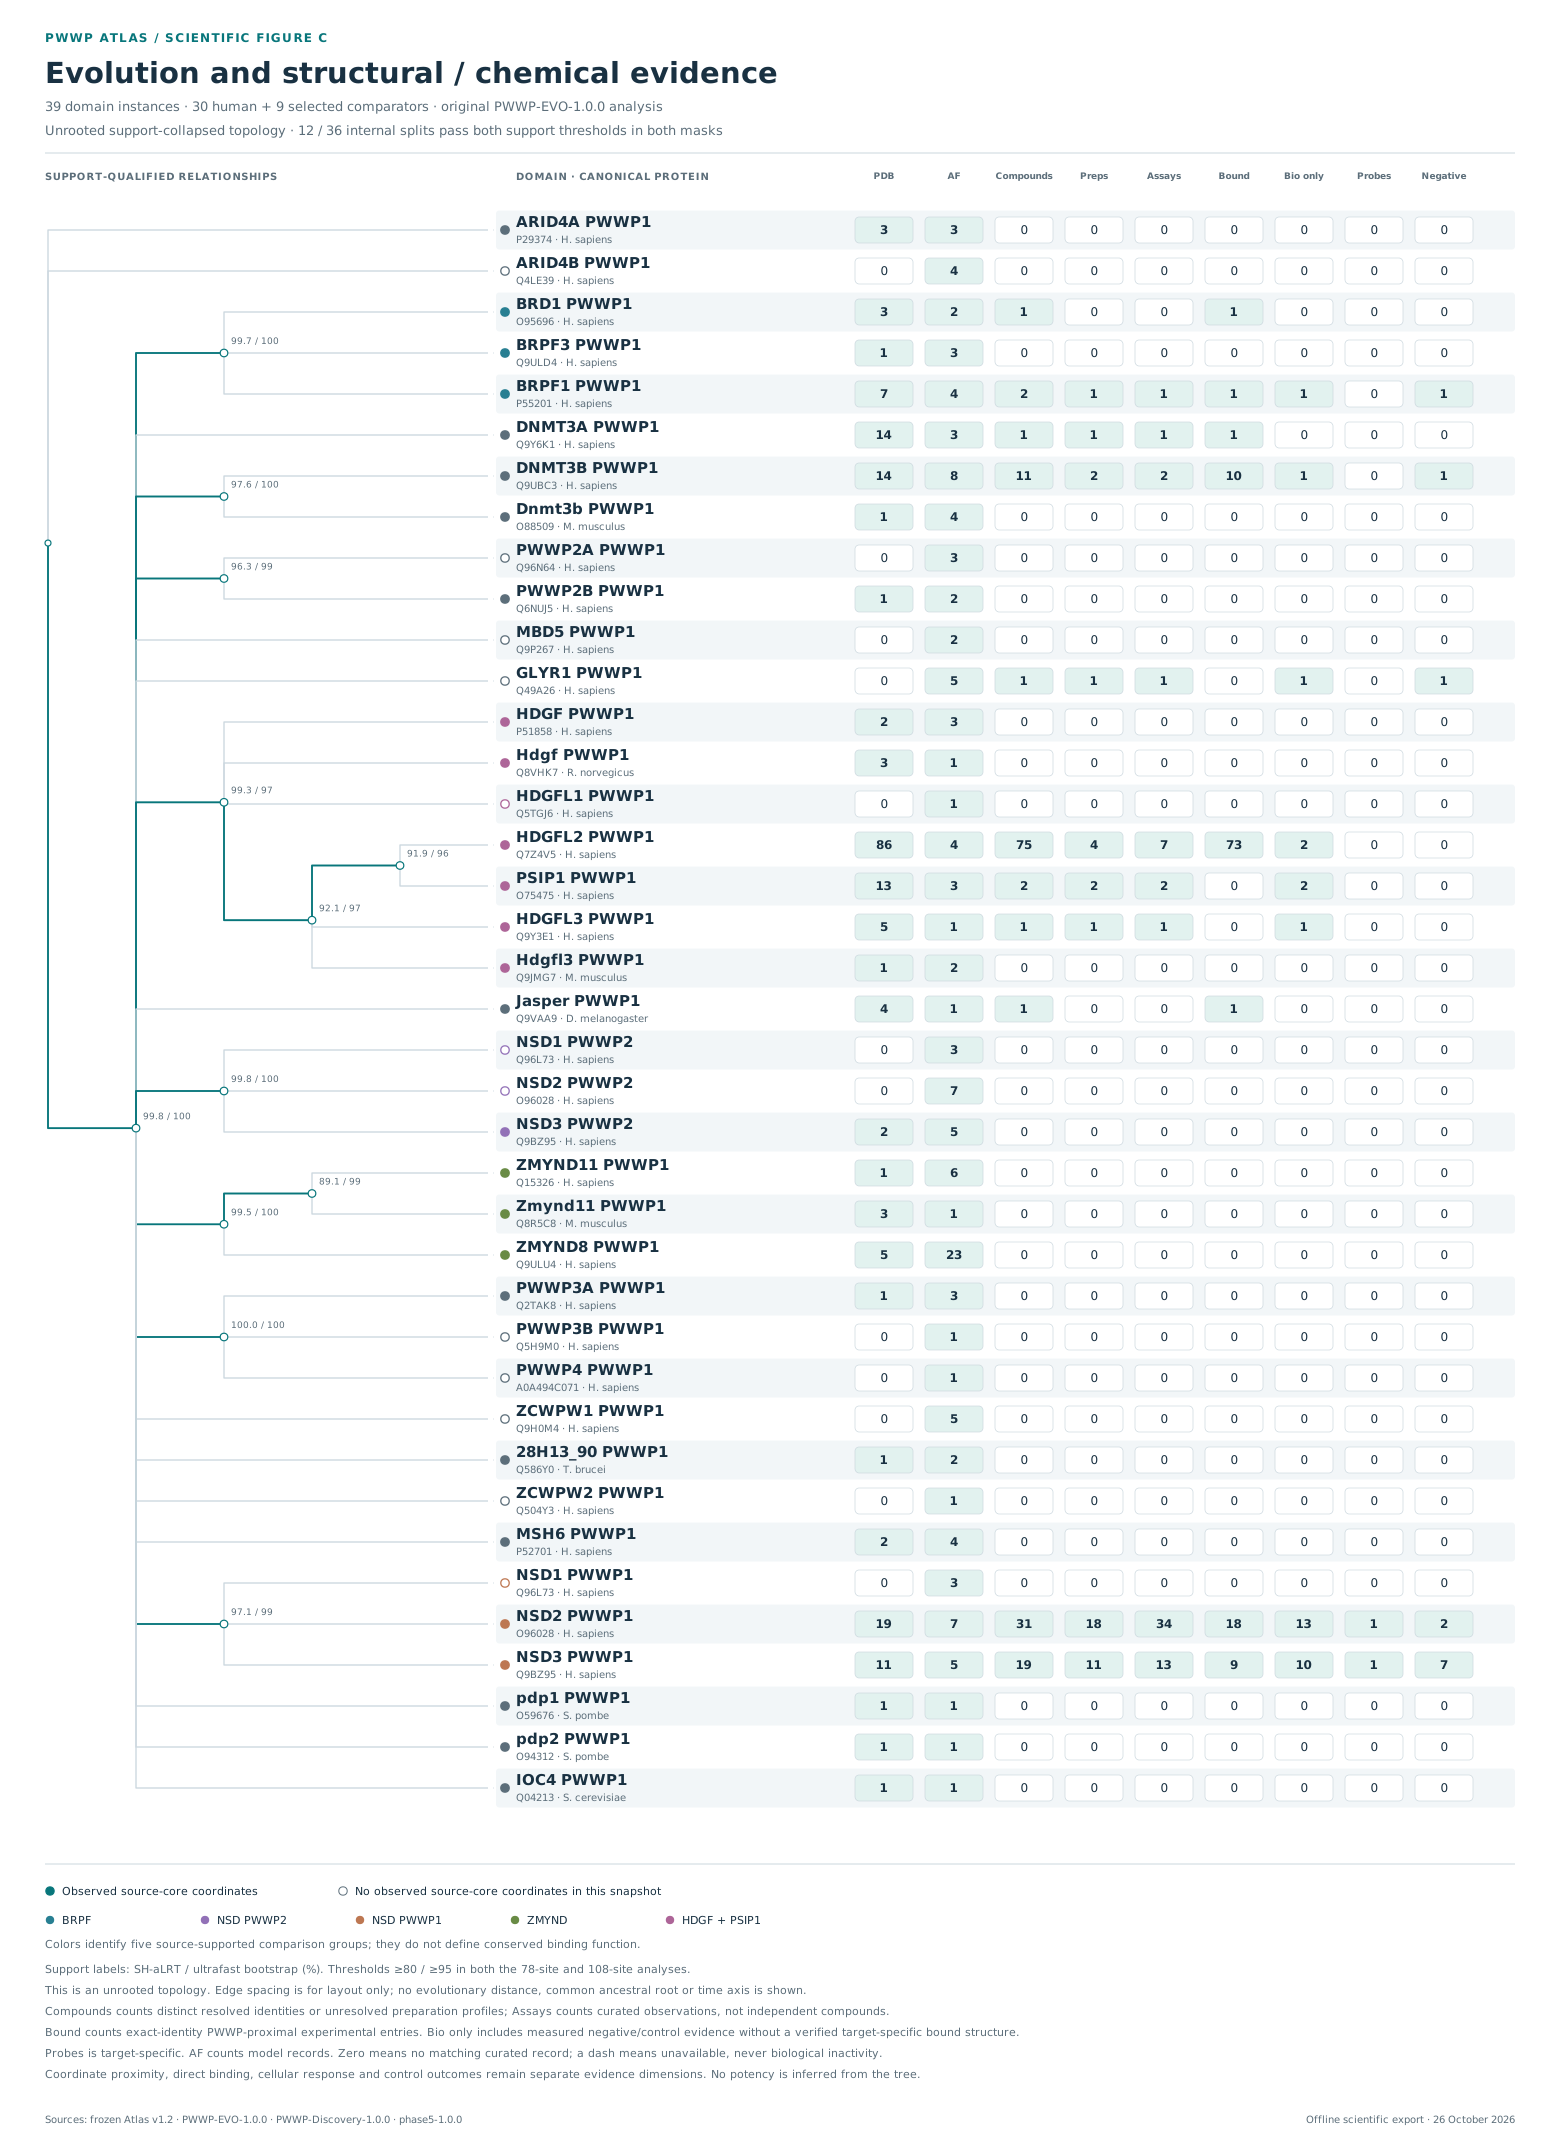
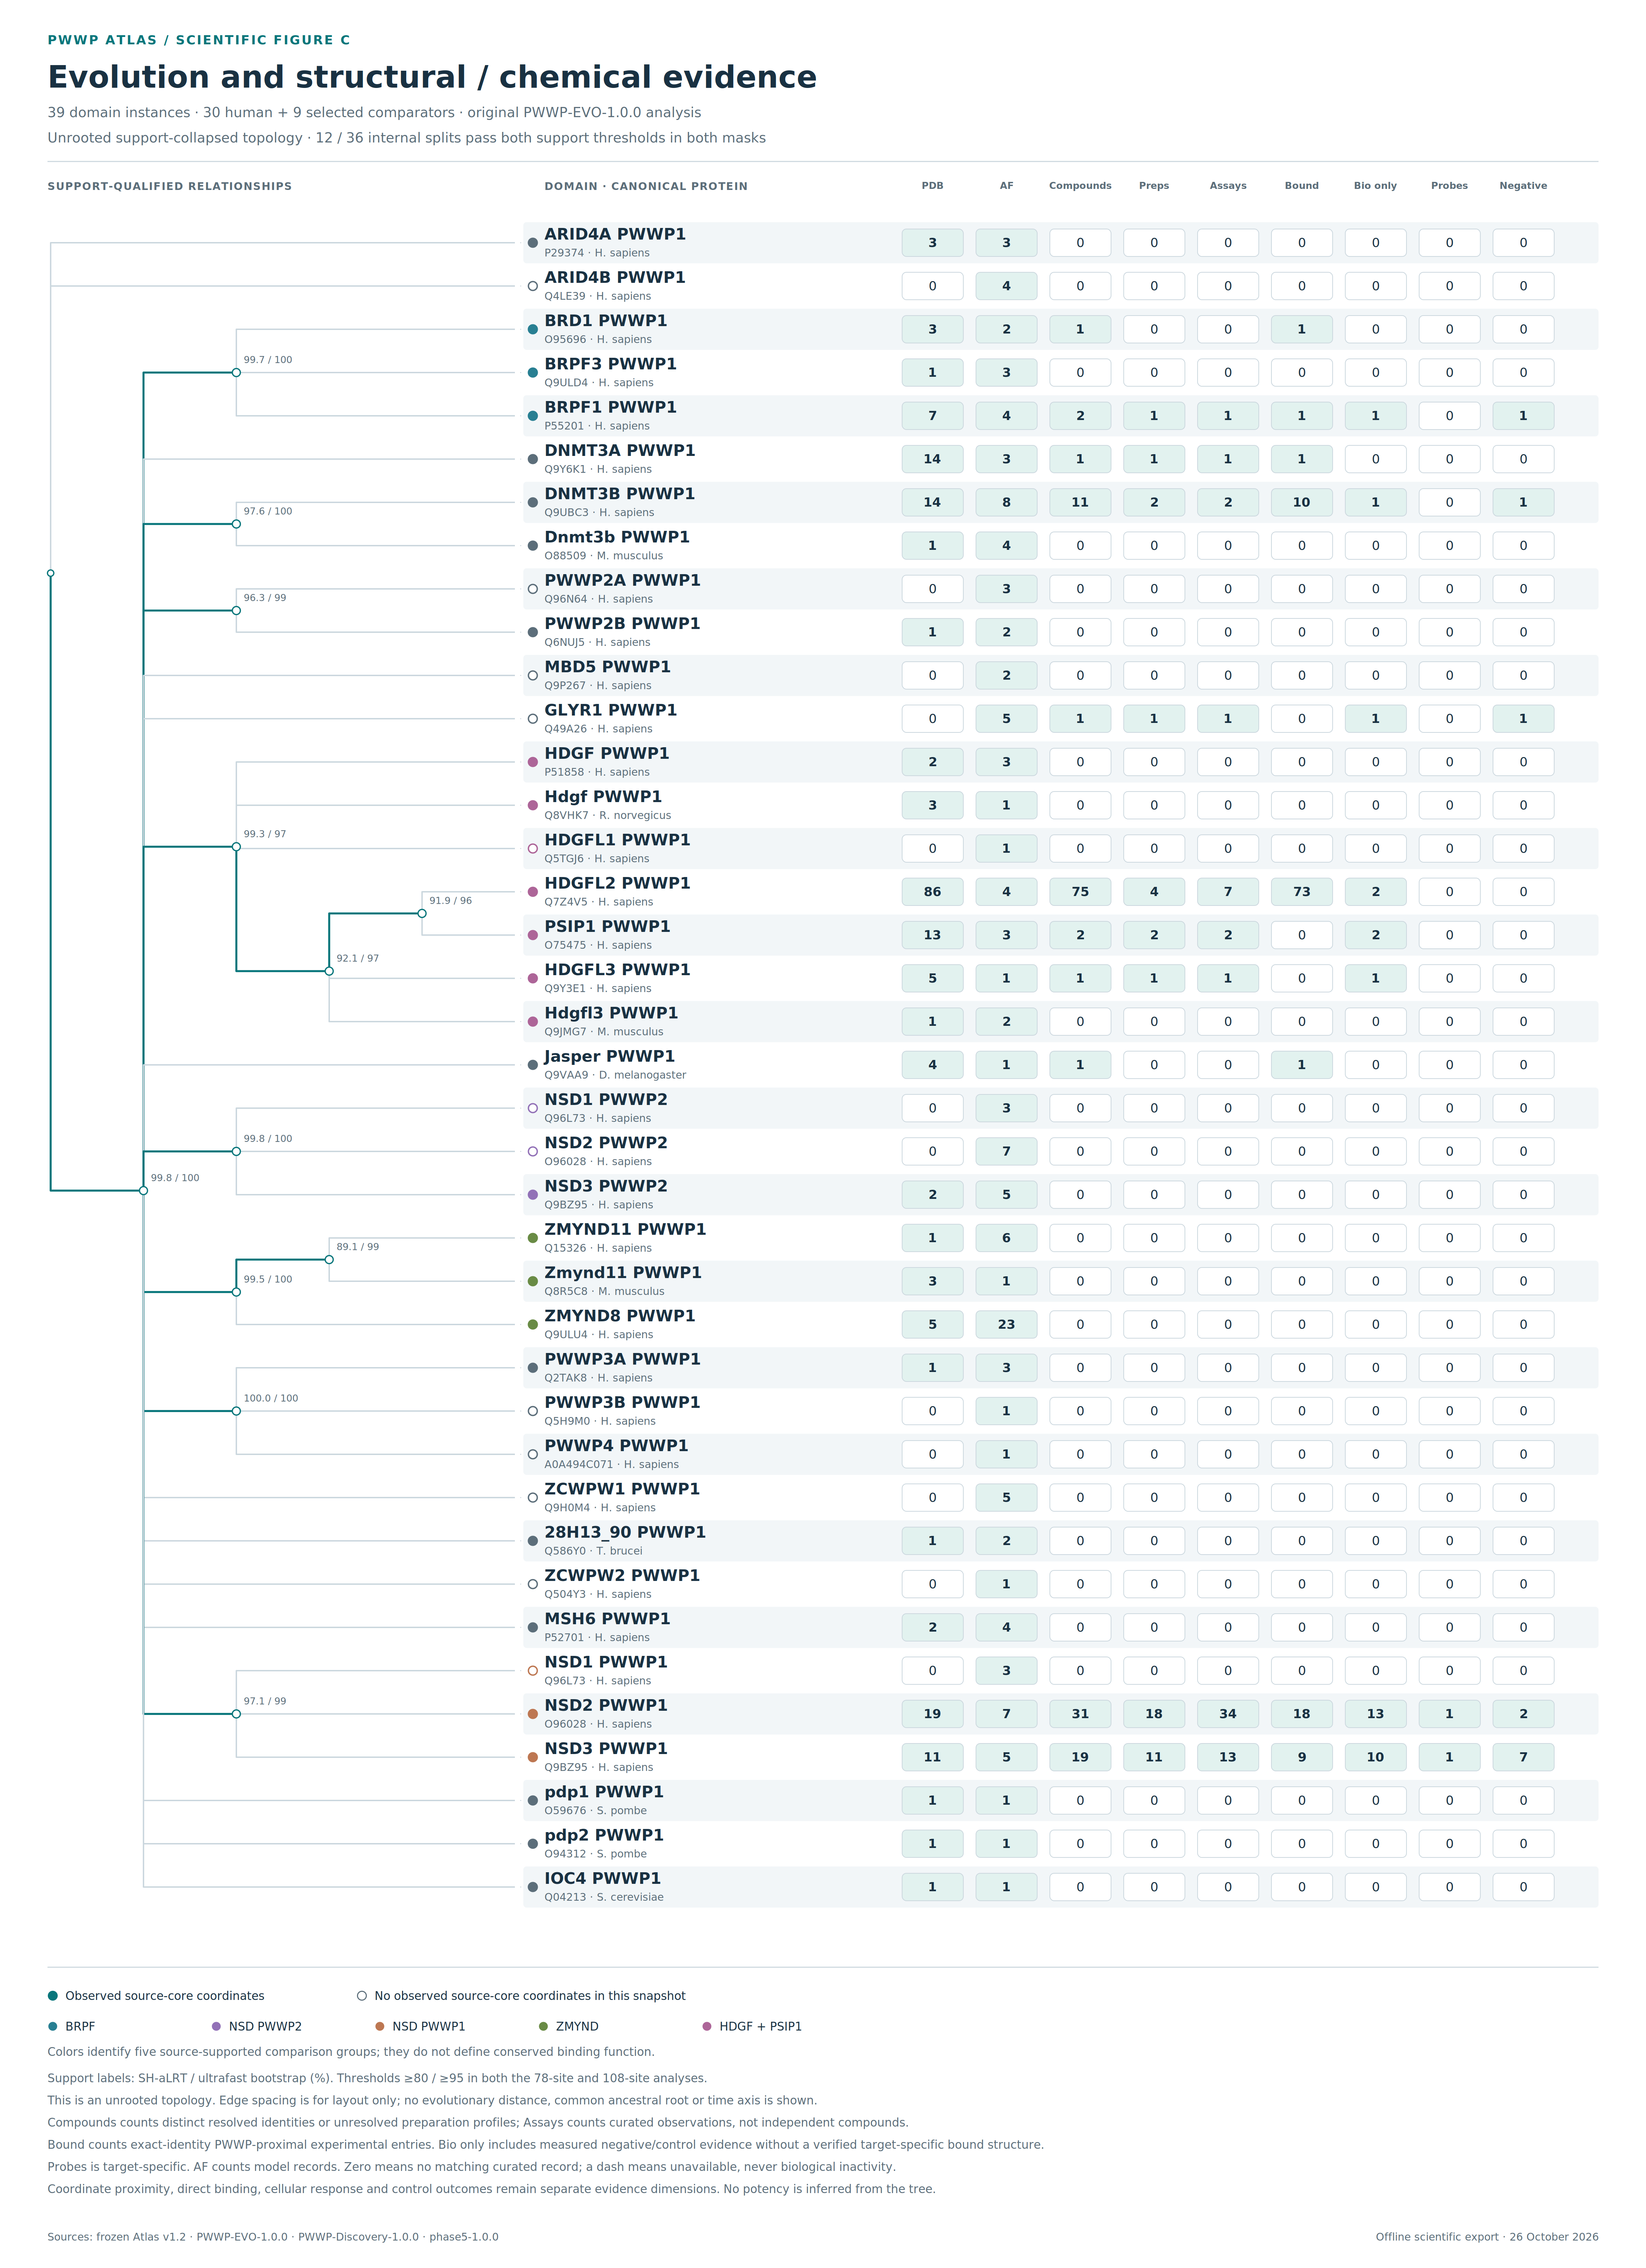
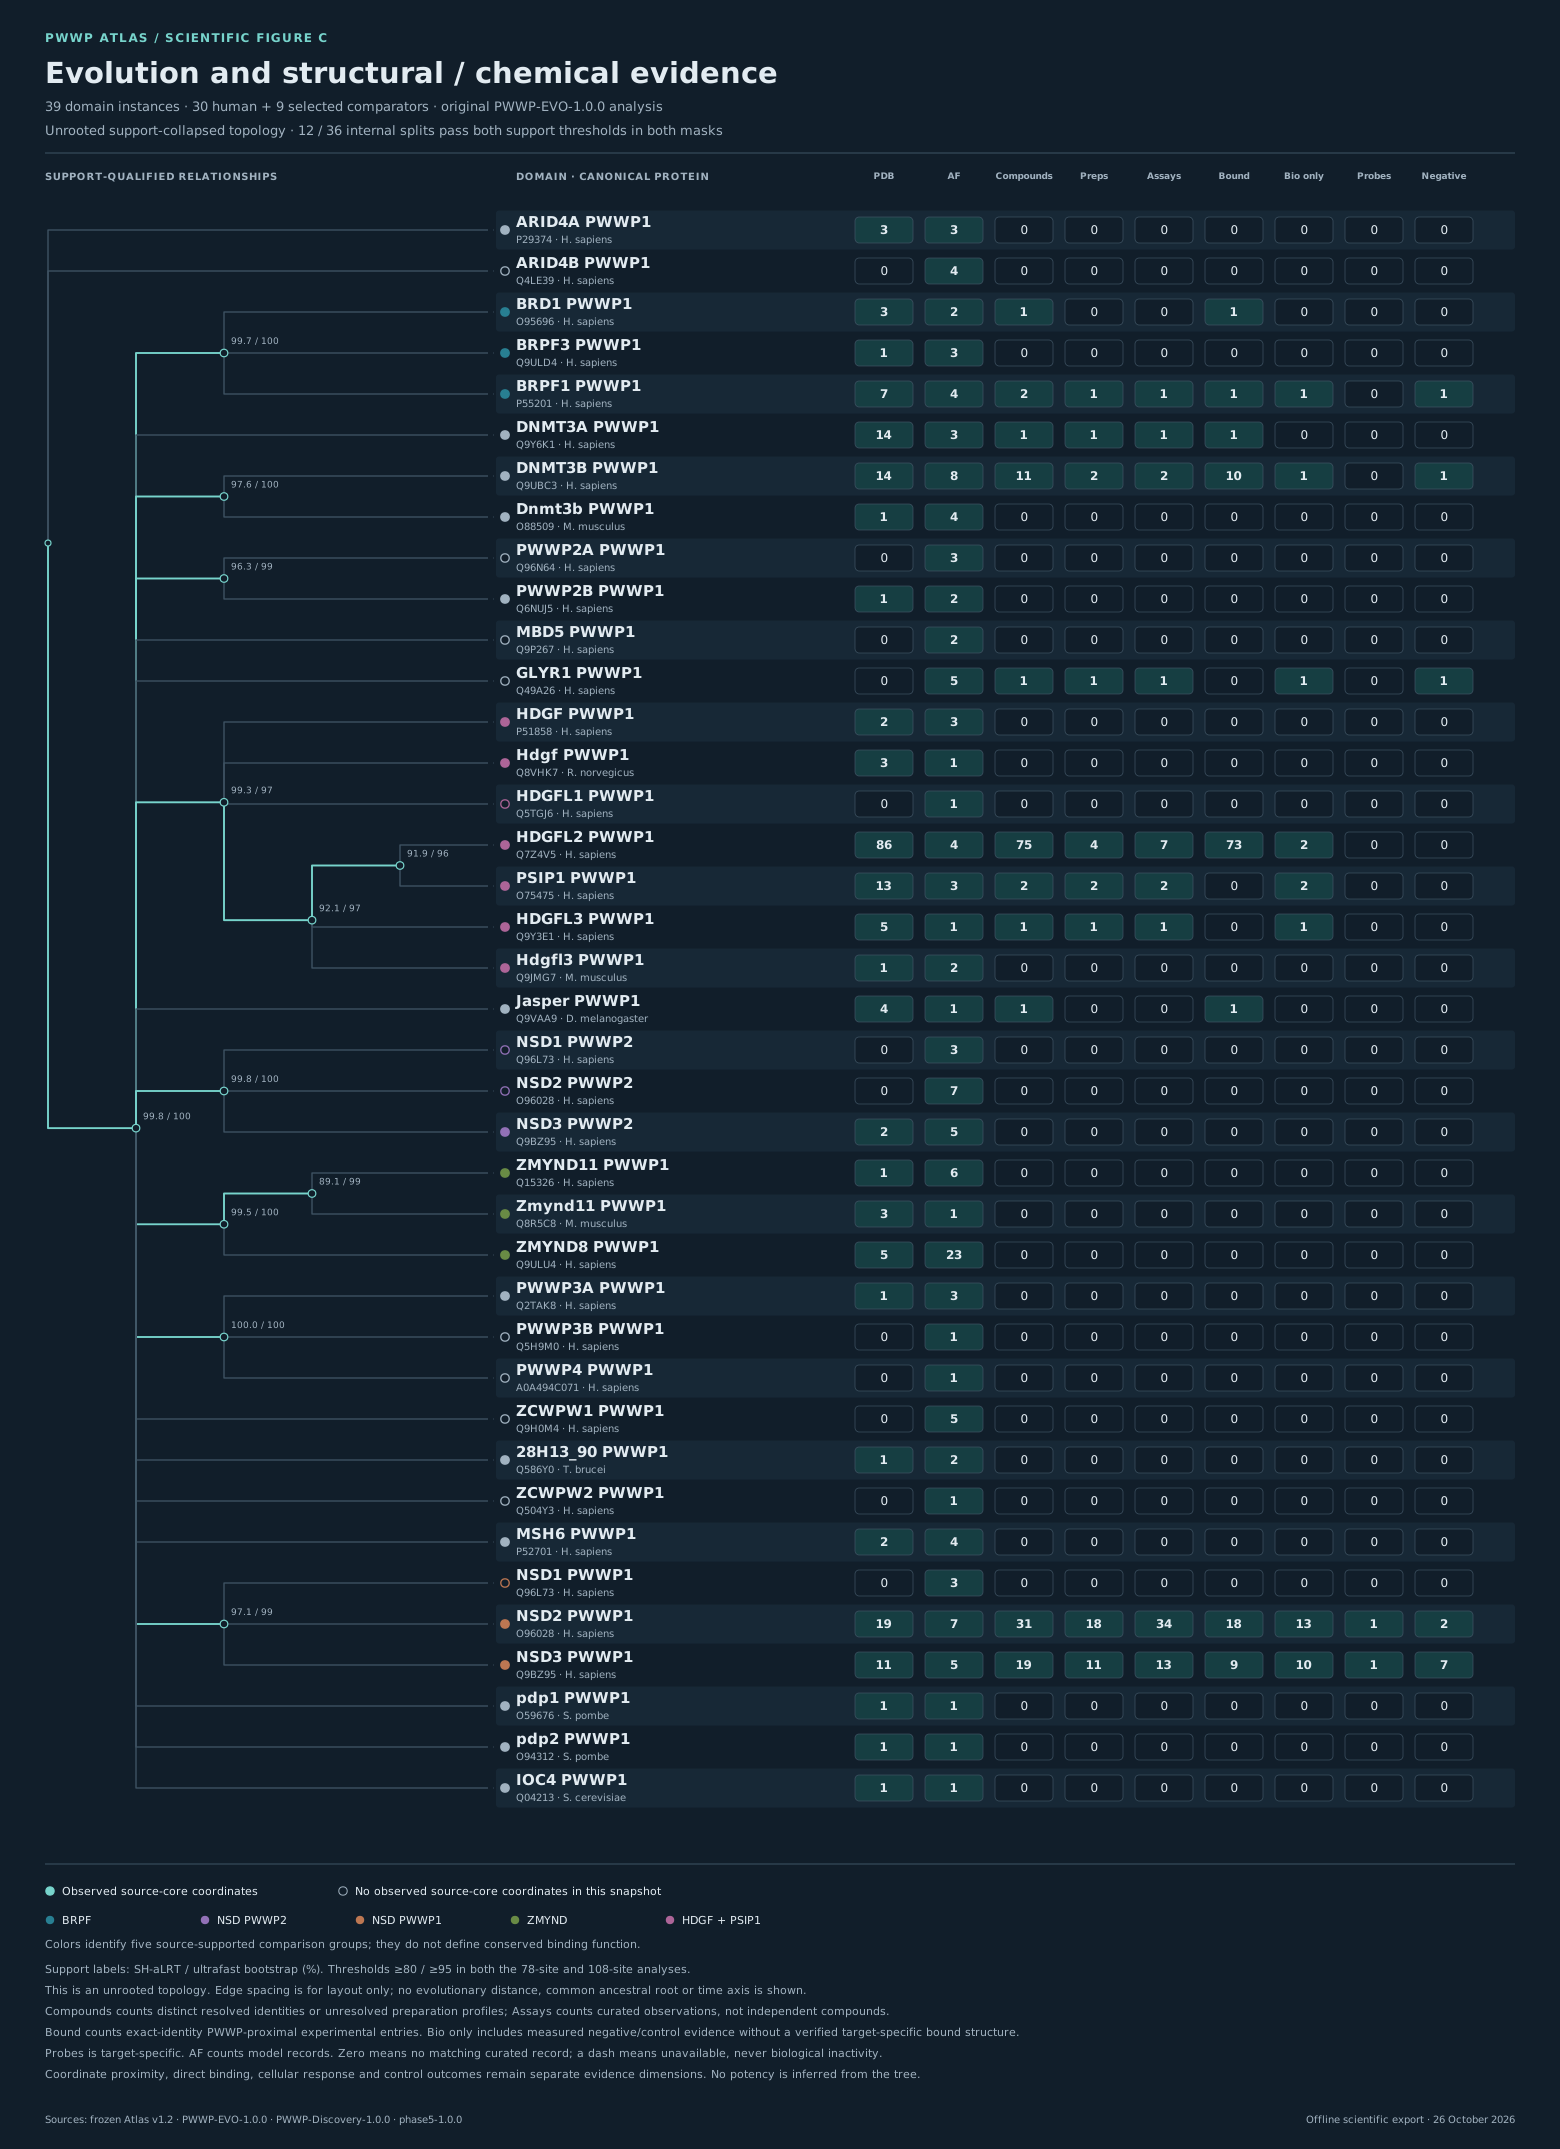
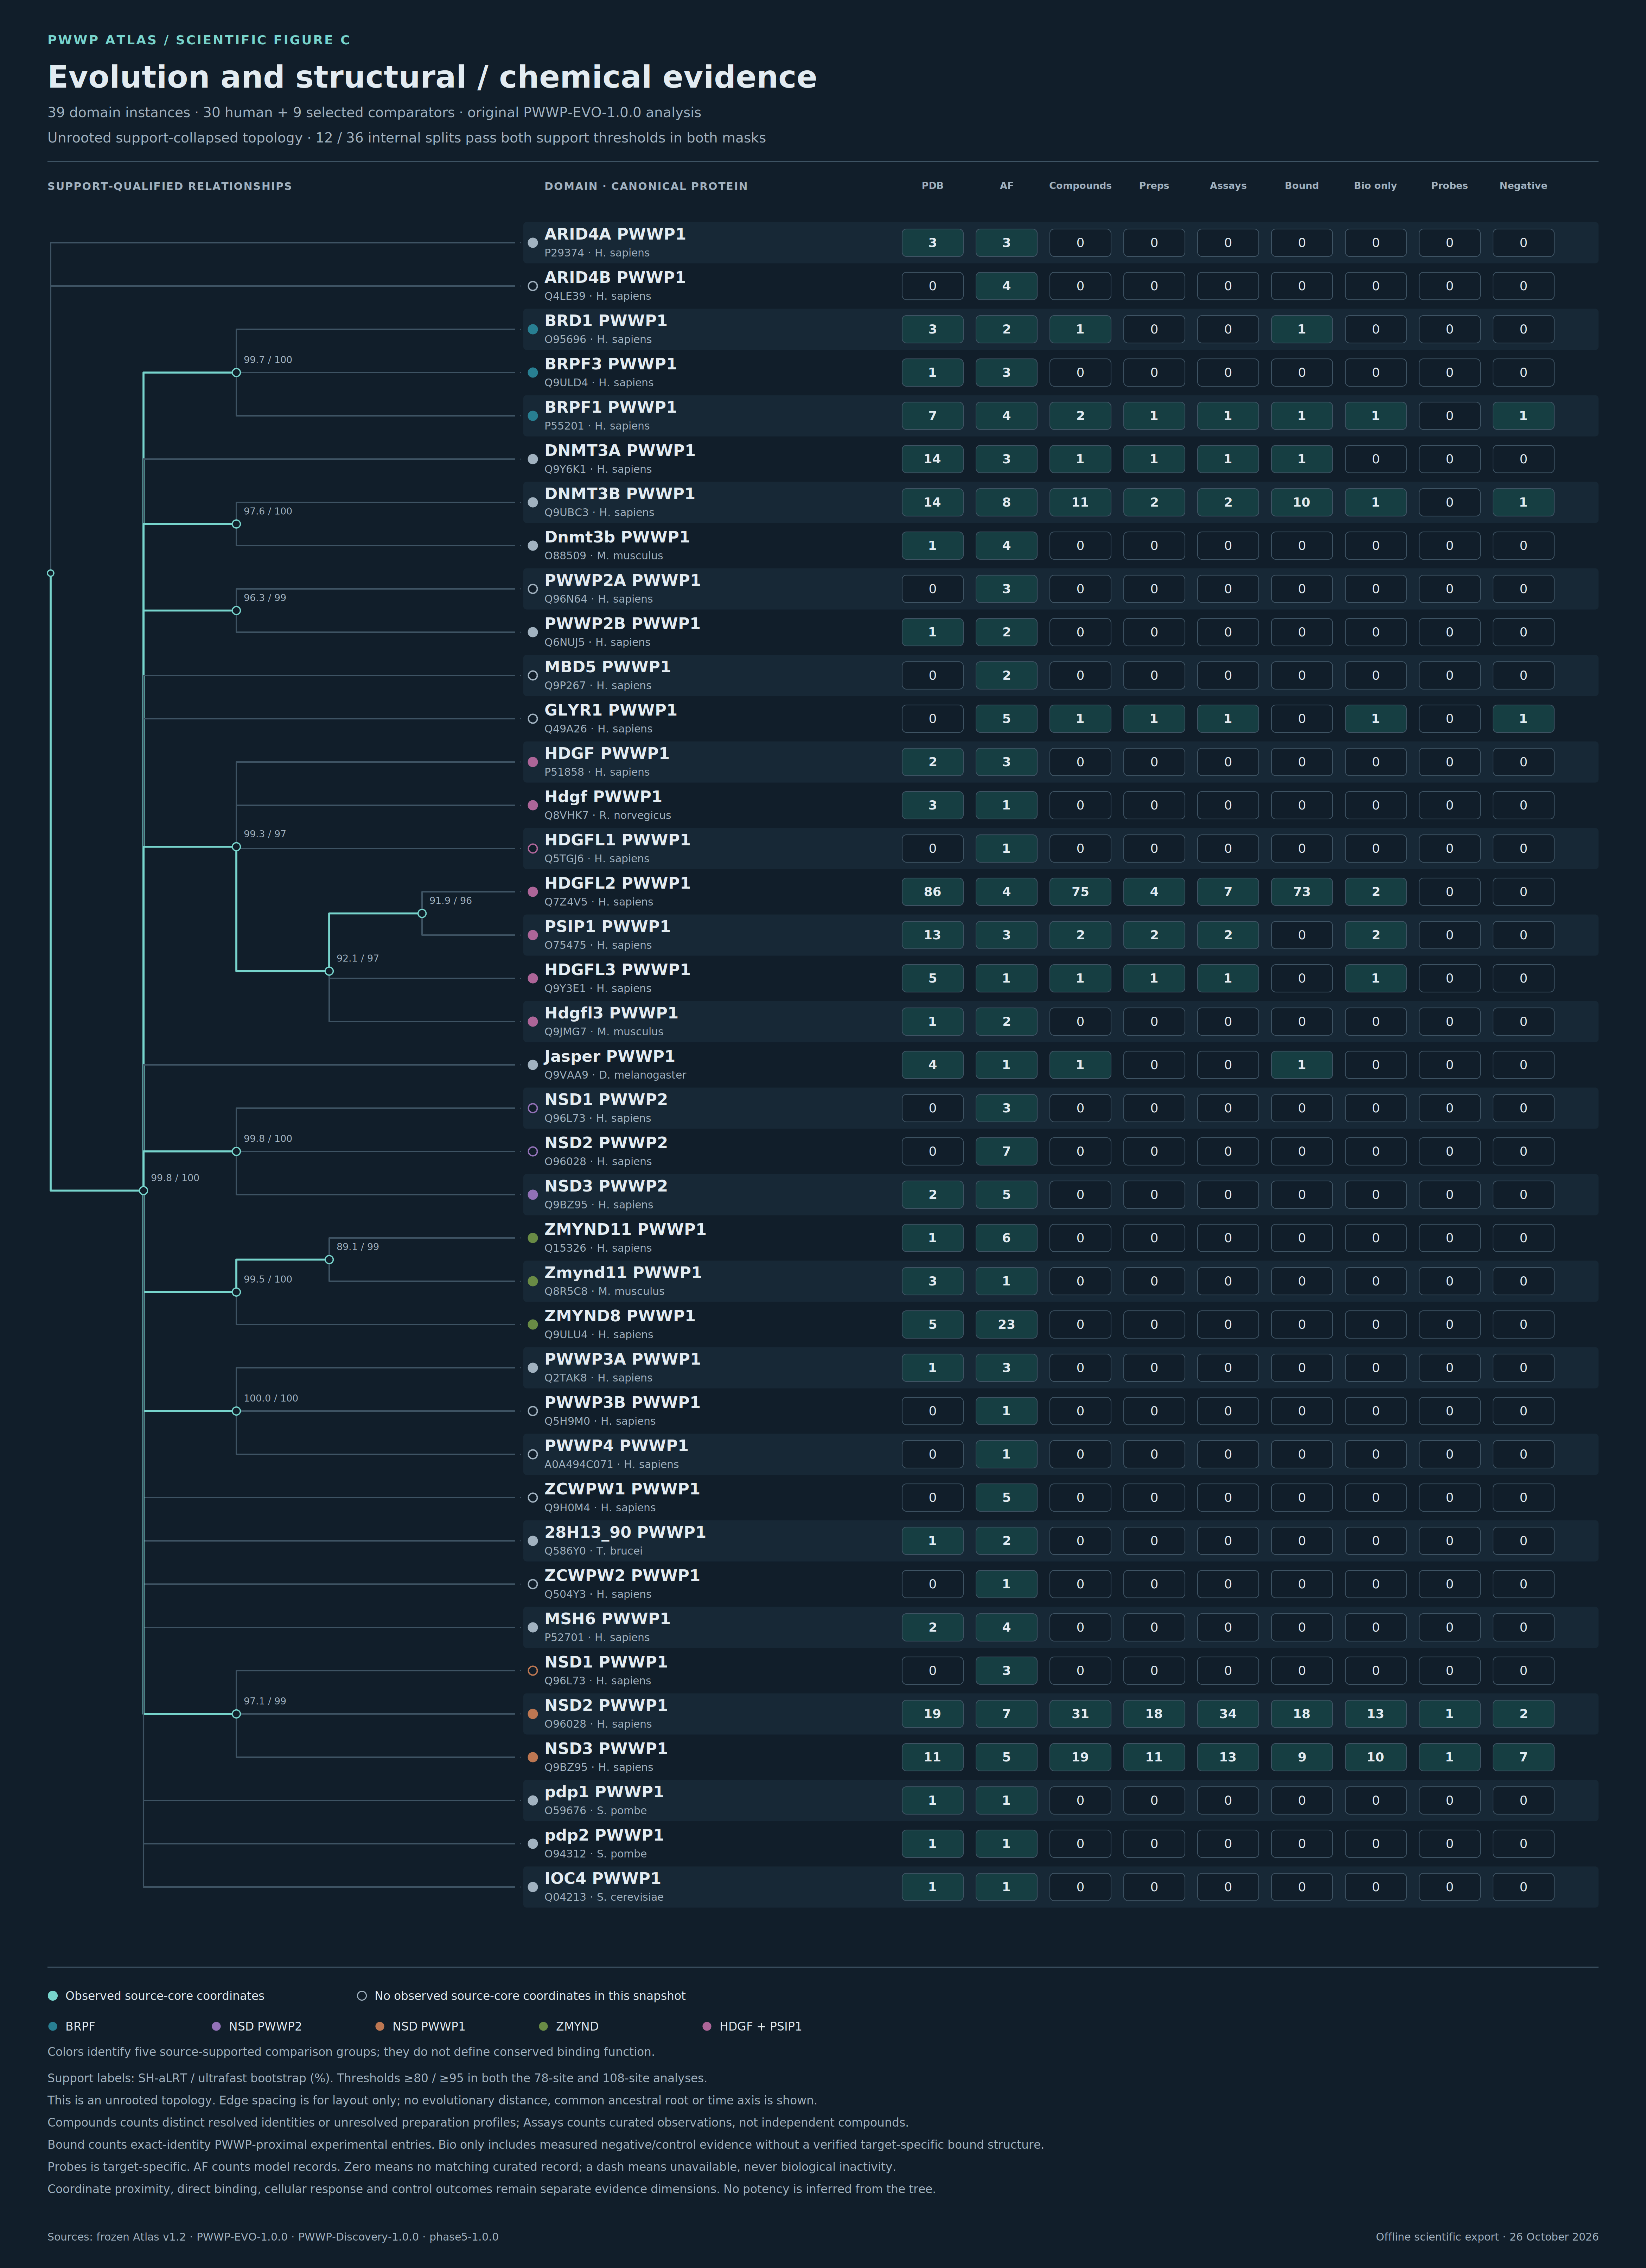
Figure C
Shared tree rows connect each domain to its structural and chemical evidence in the curated snapshot.
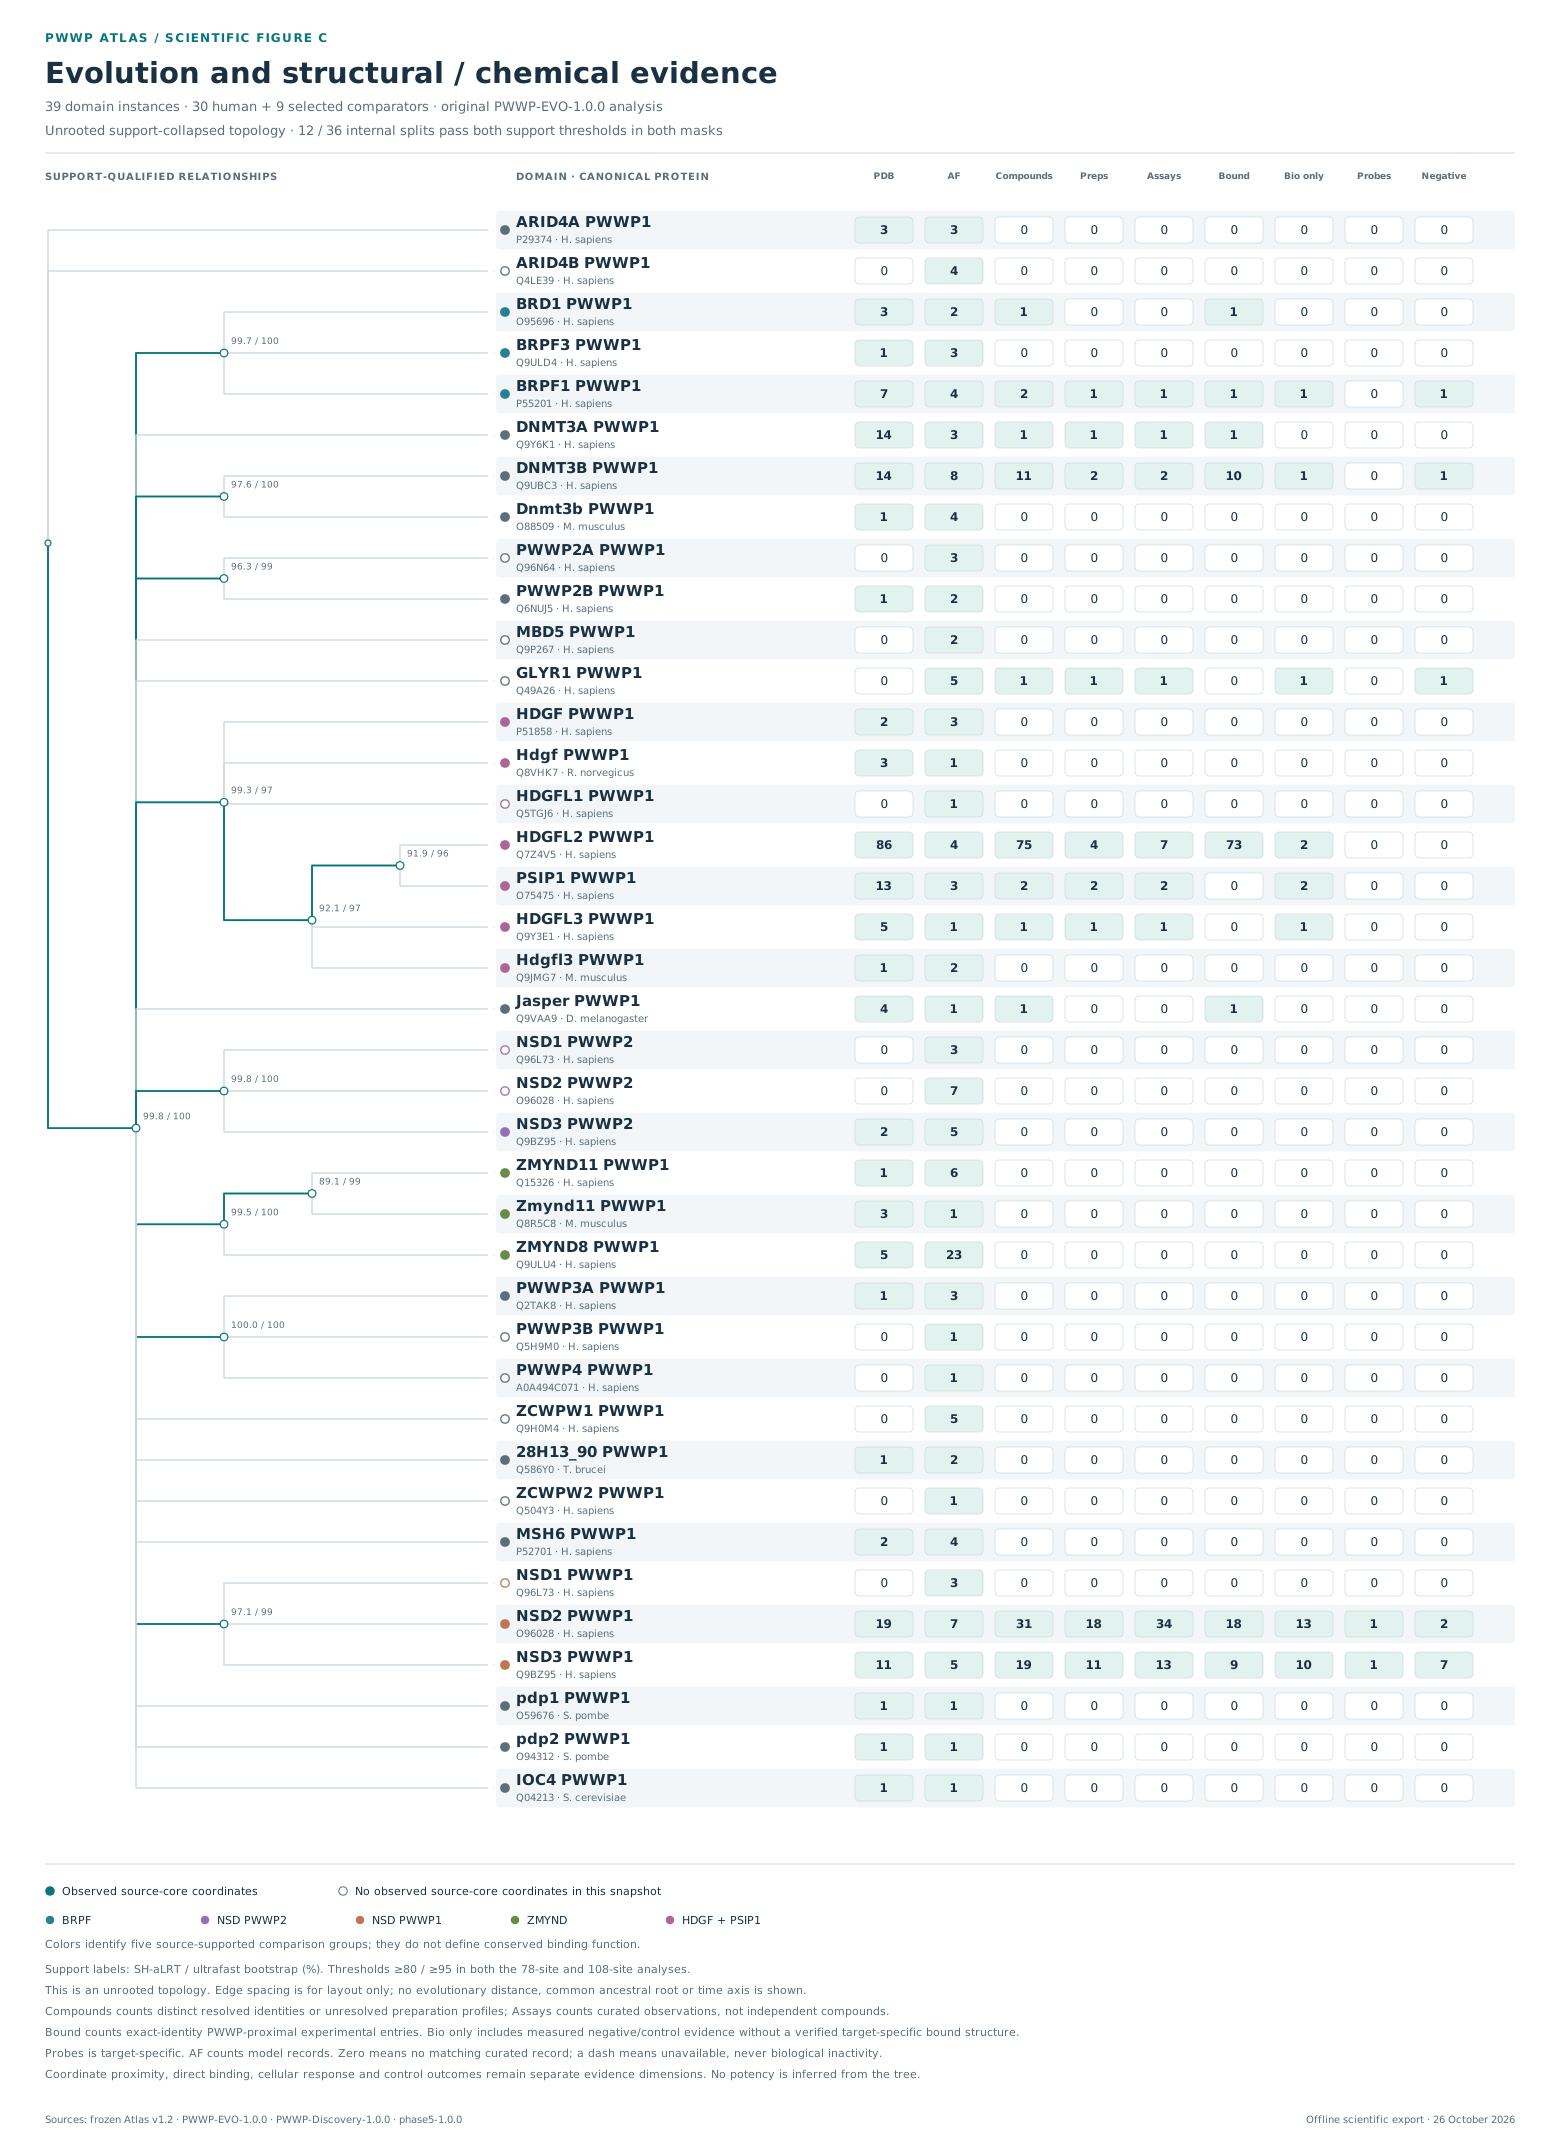
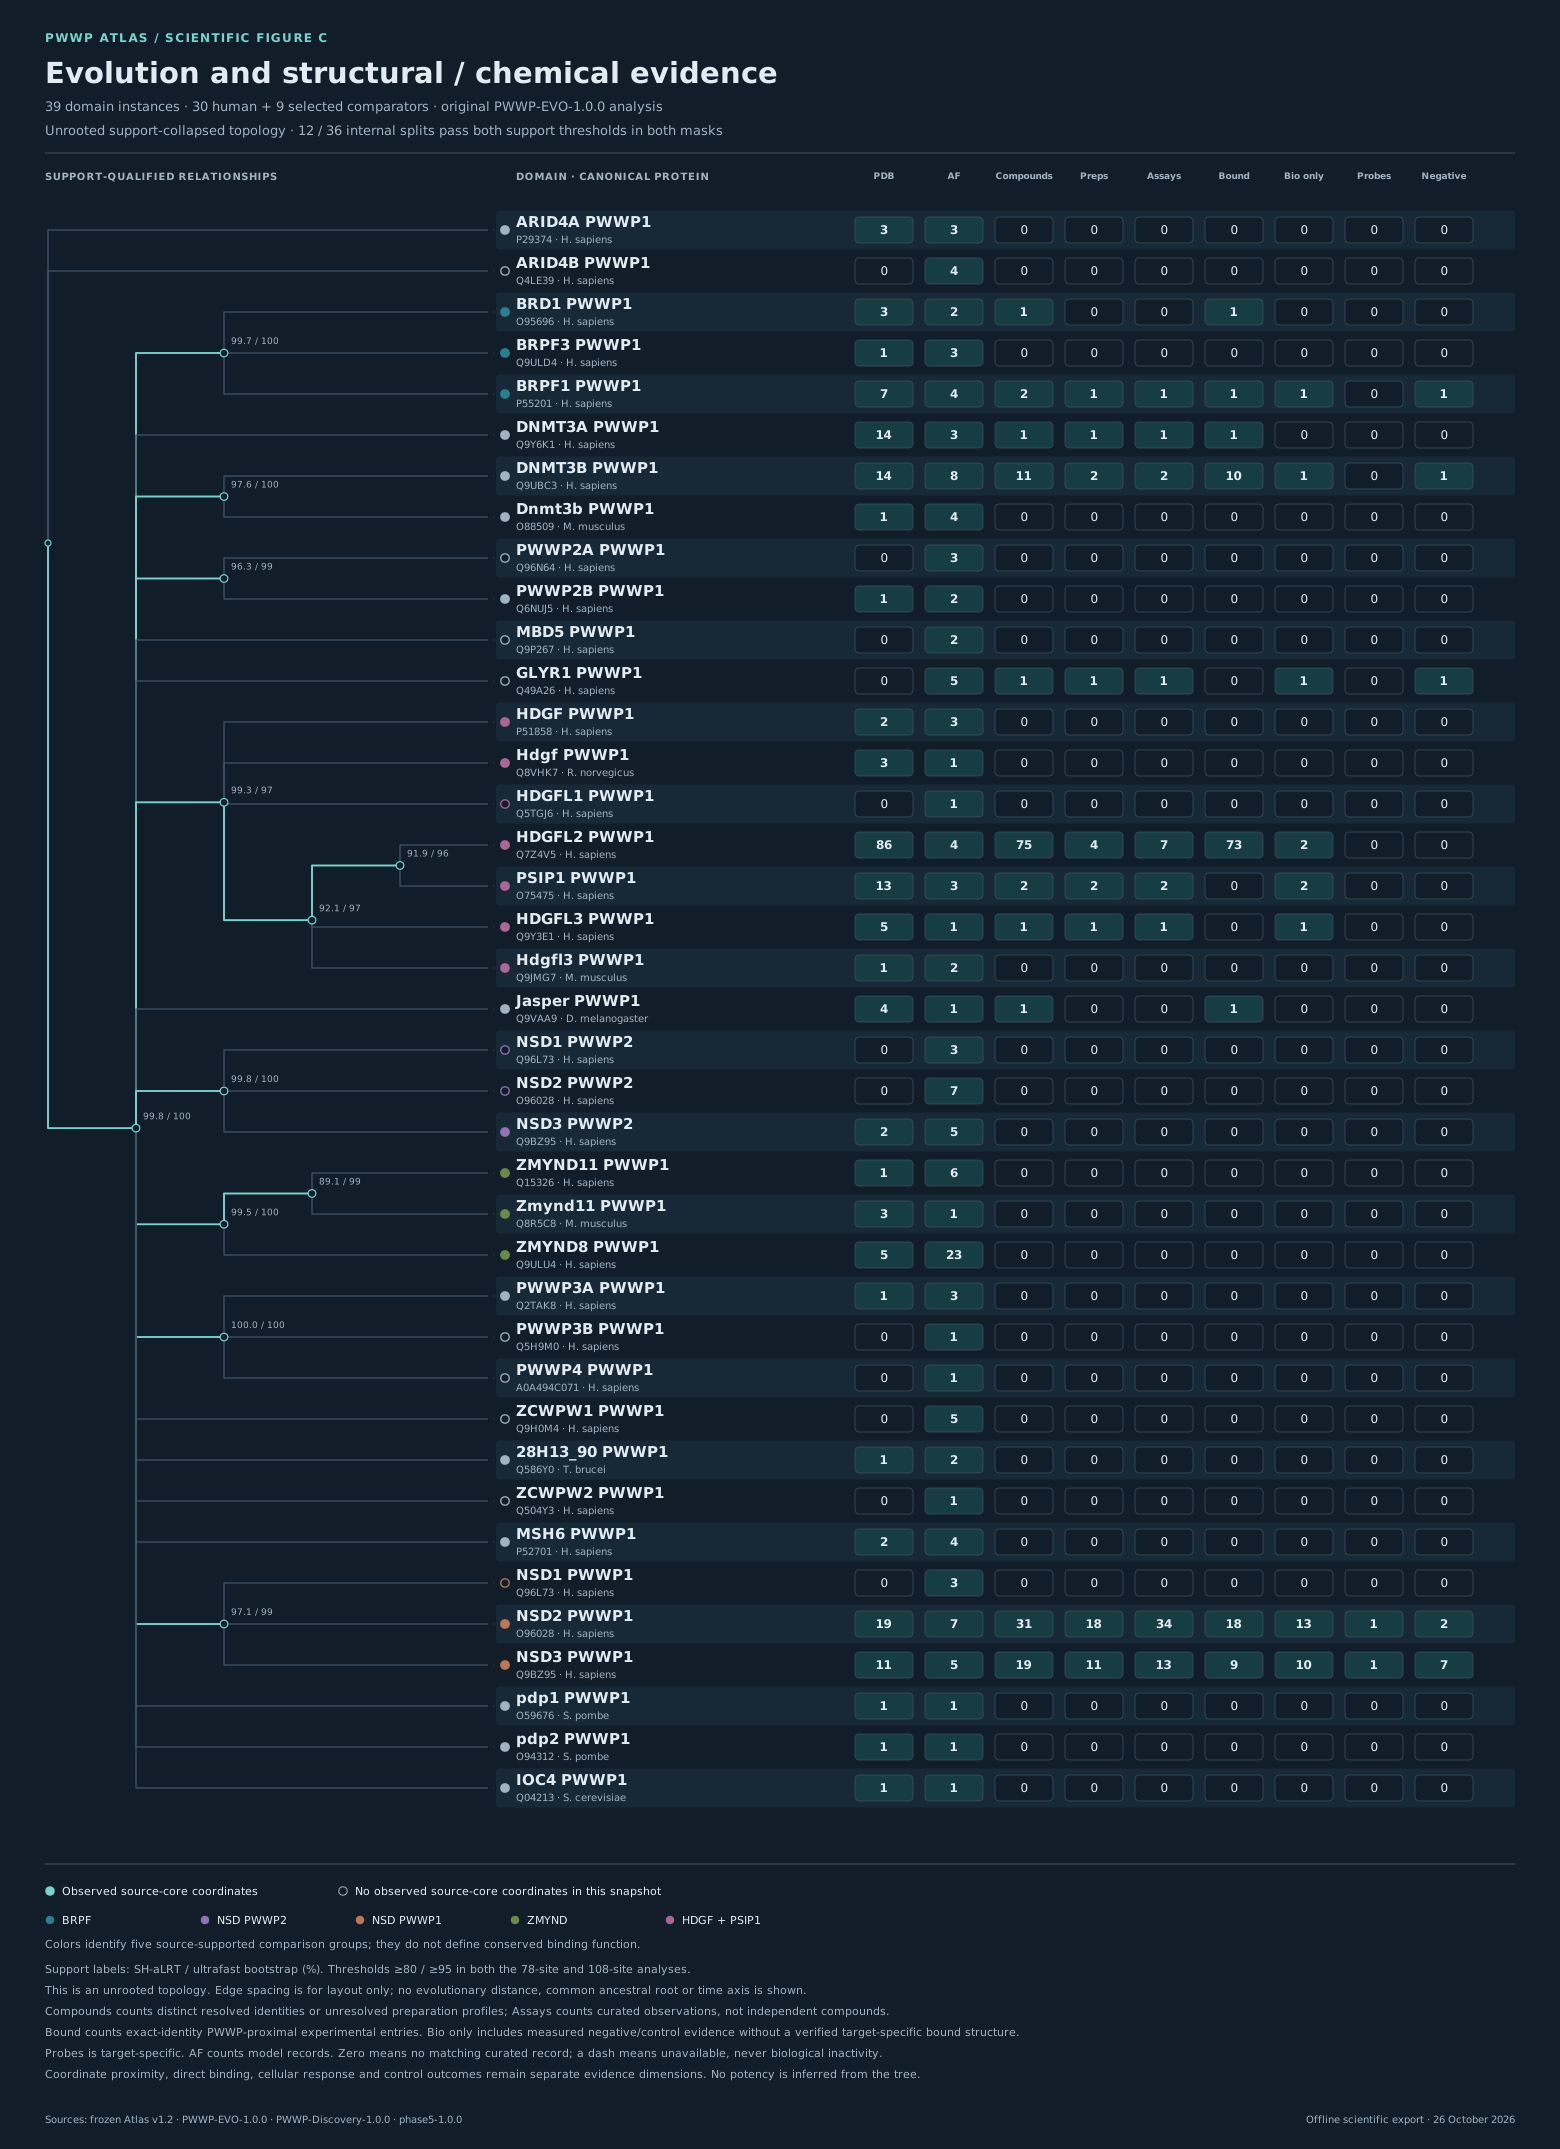
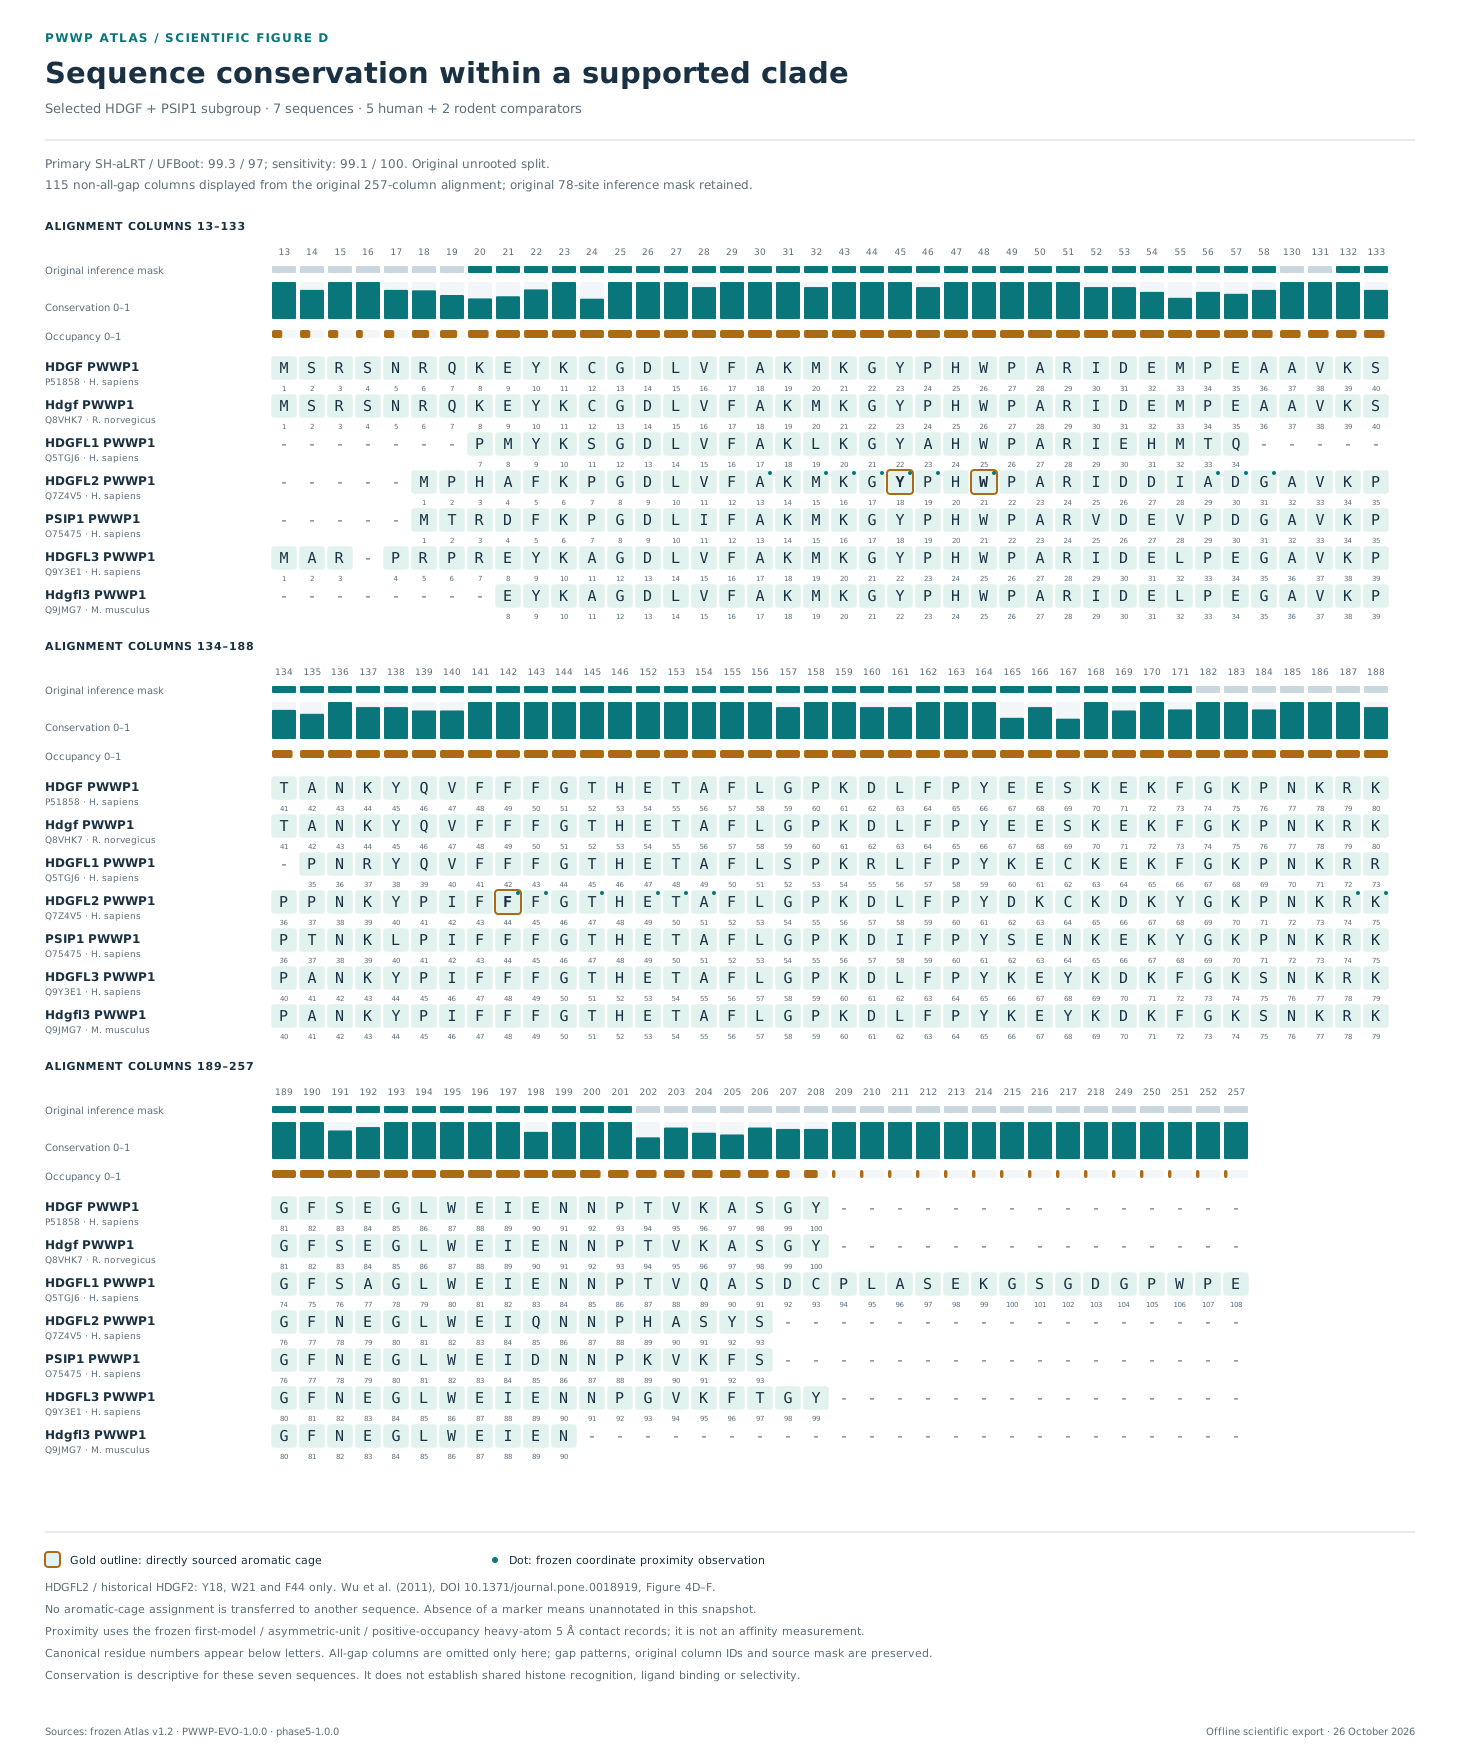
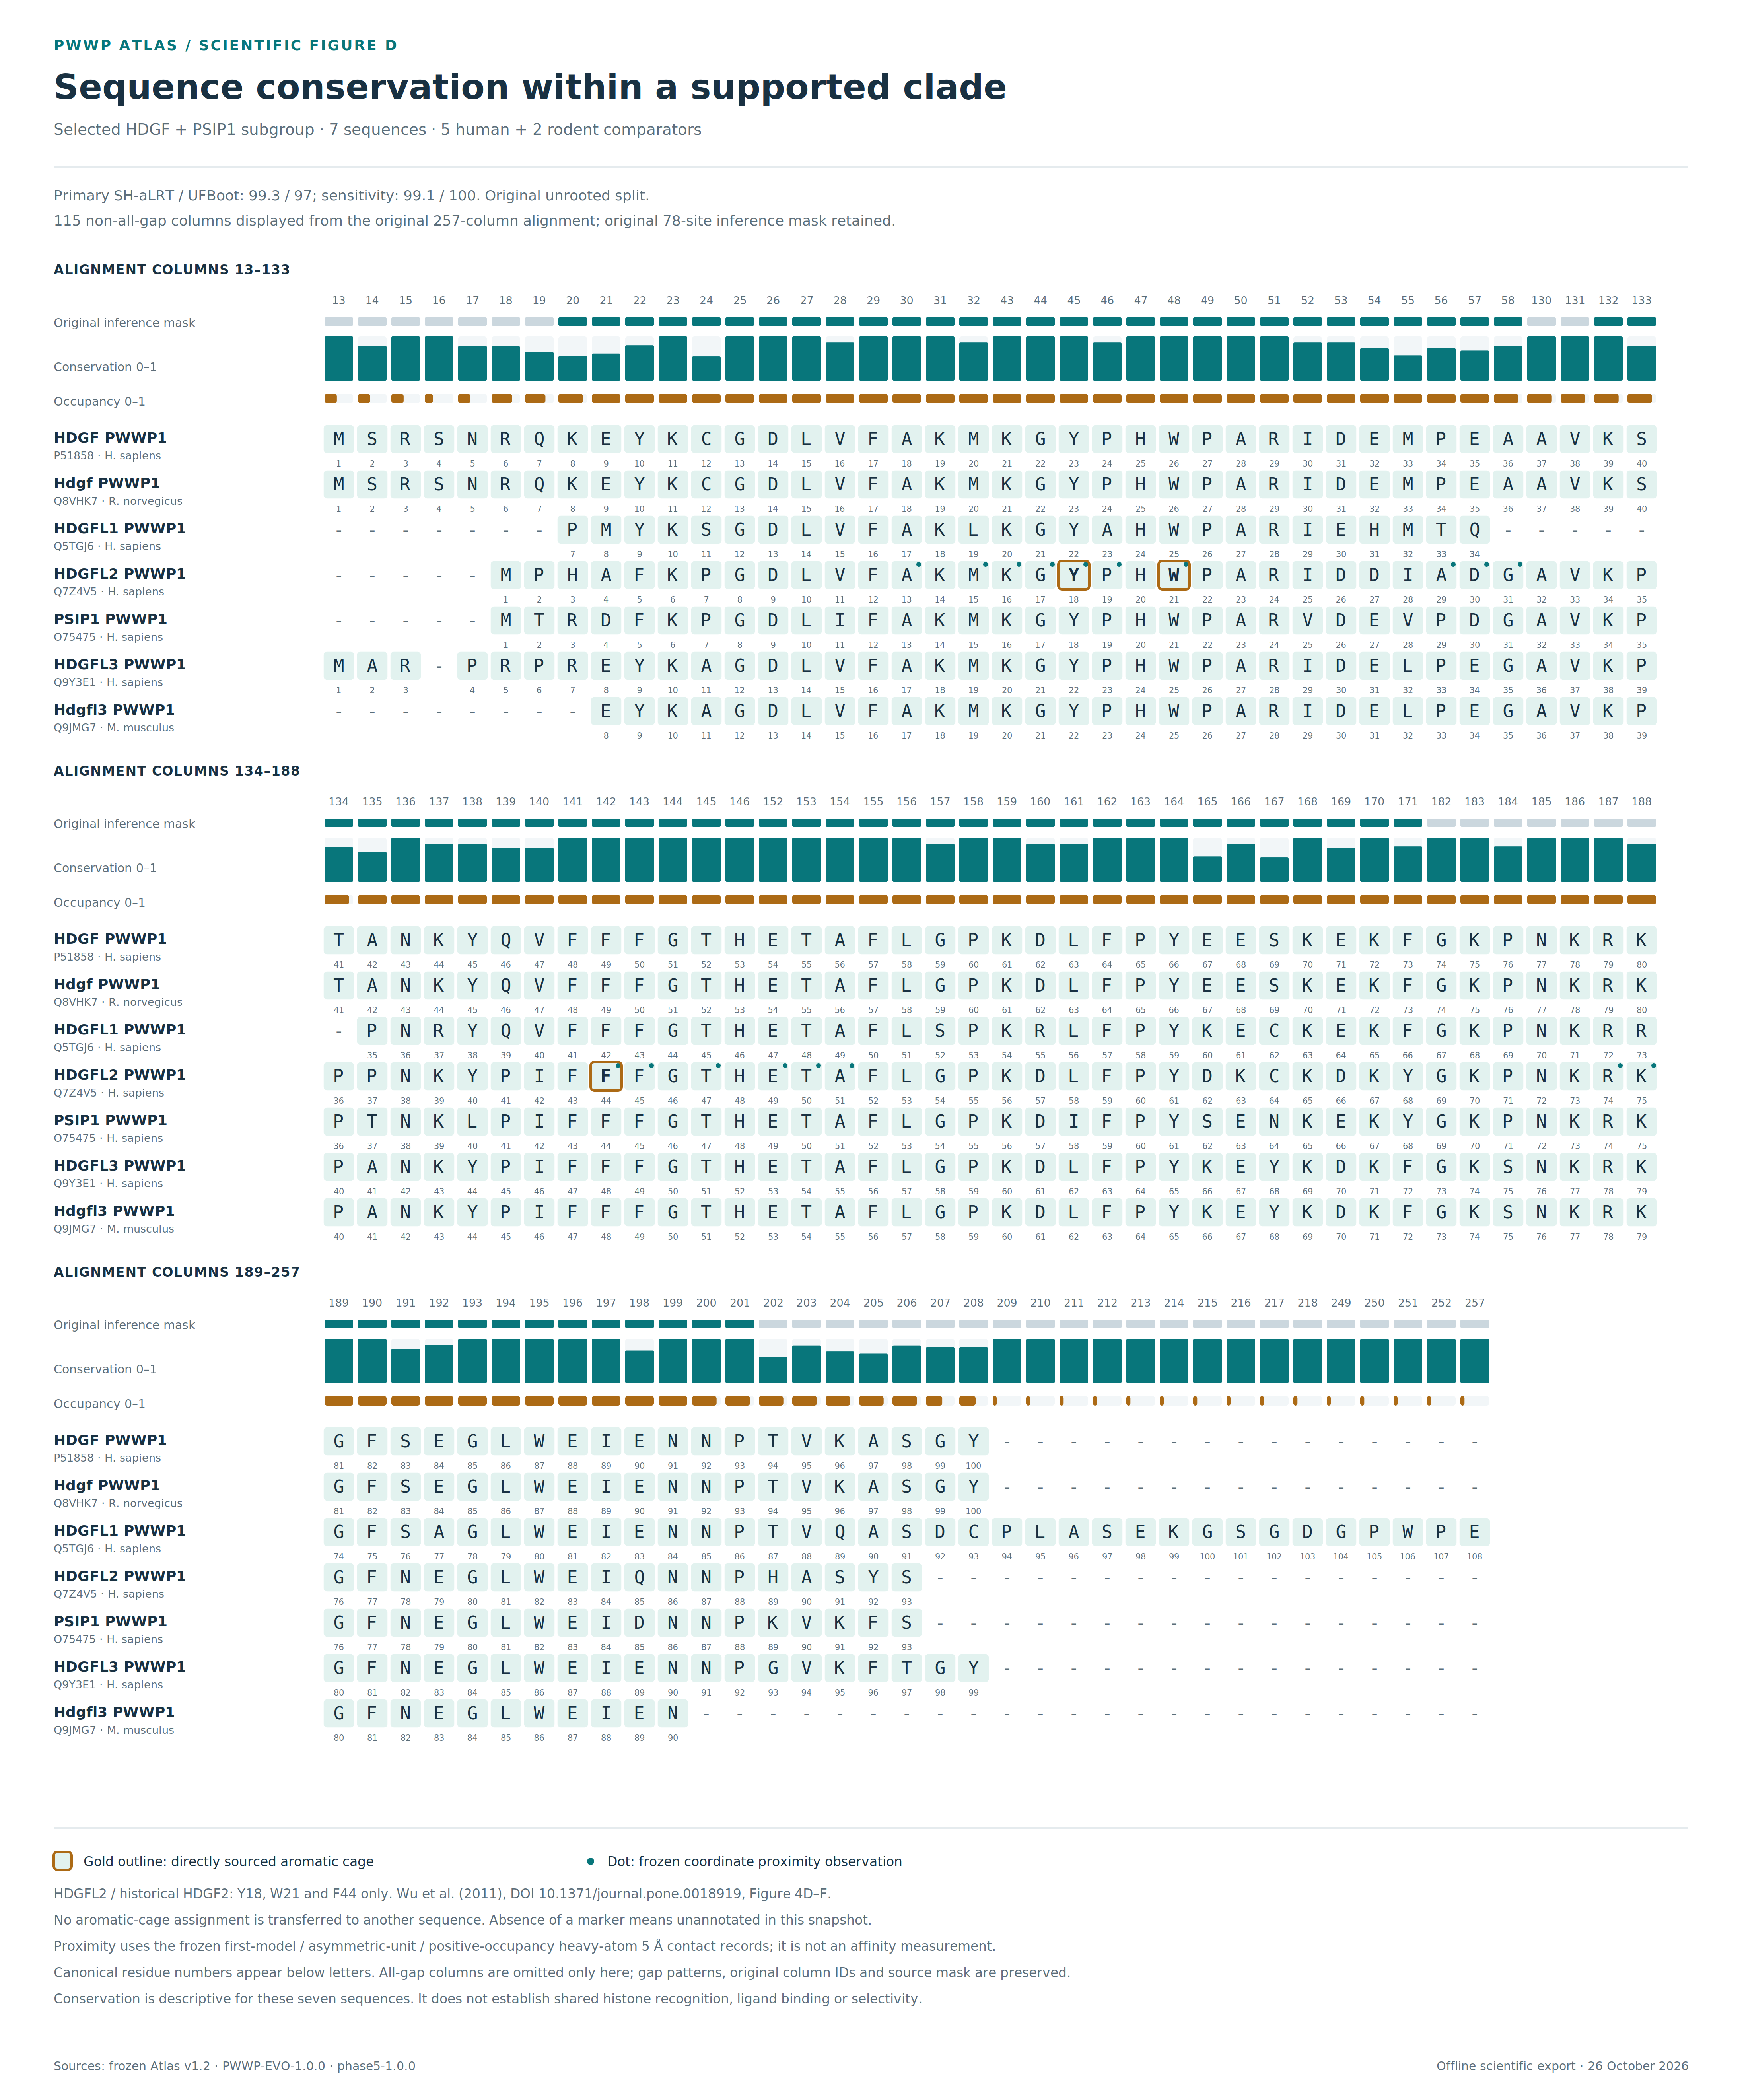
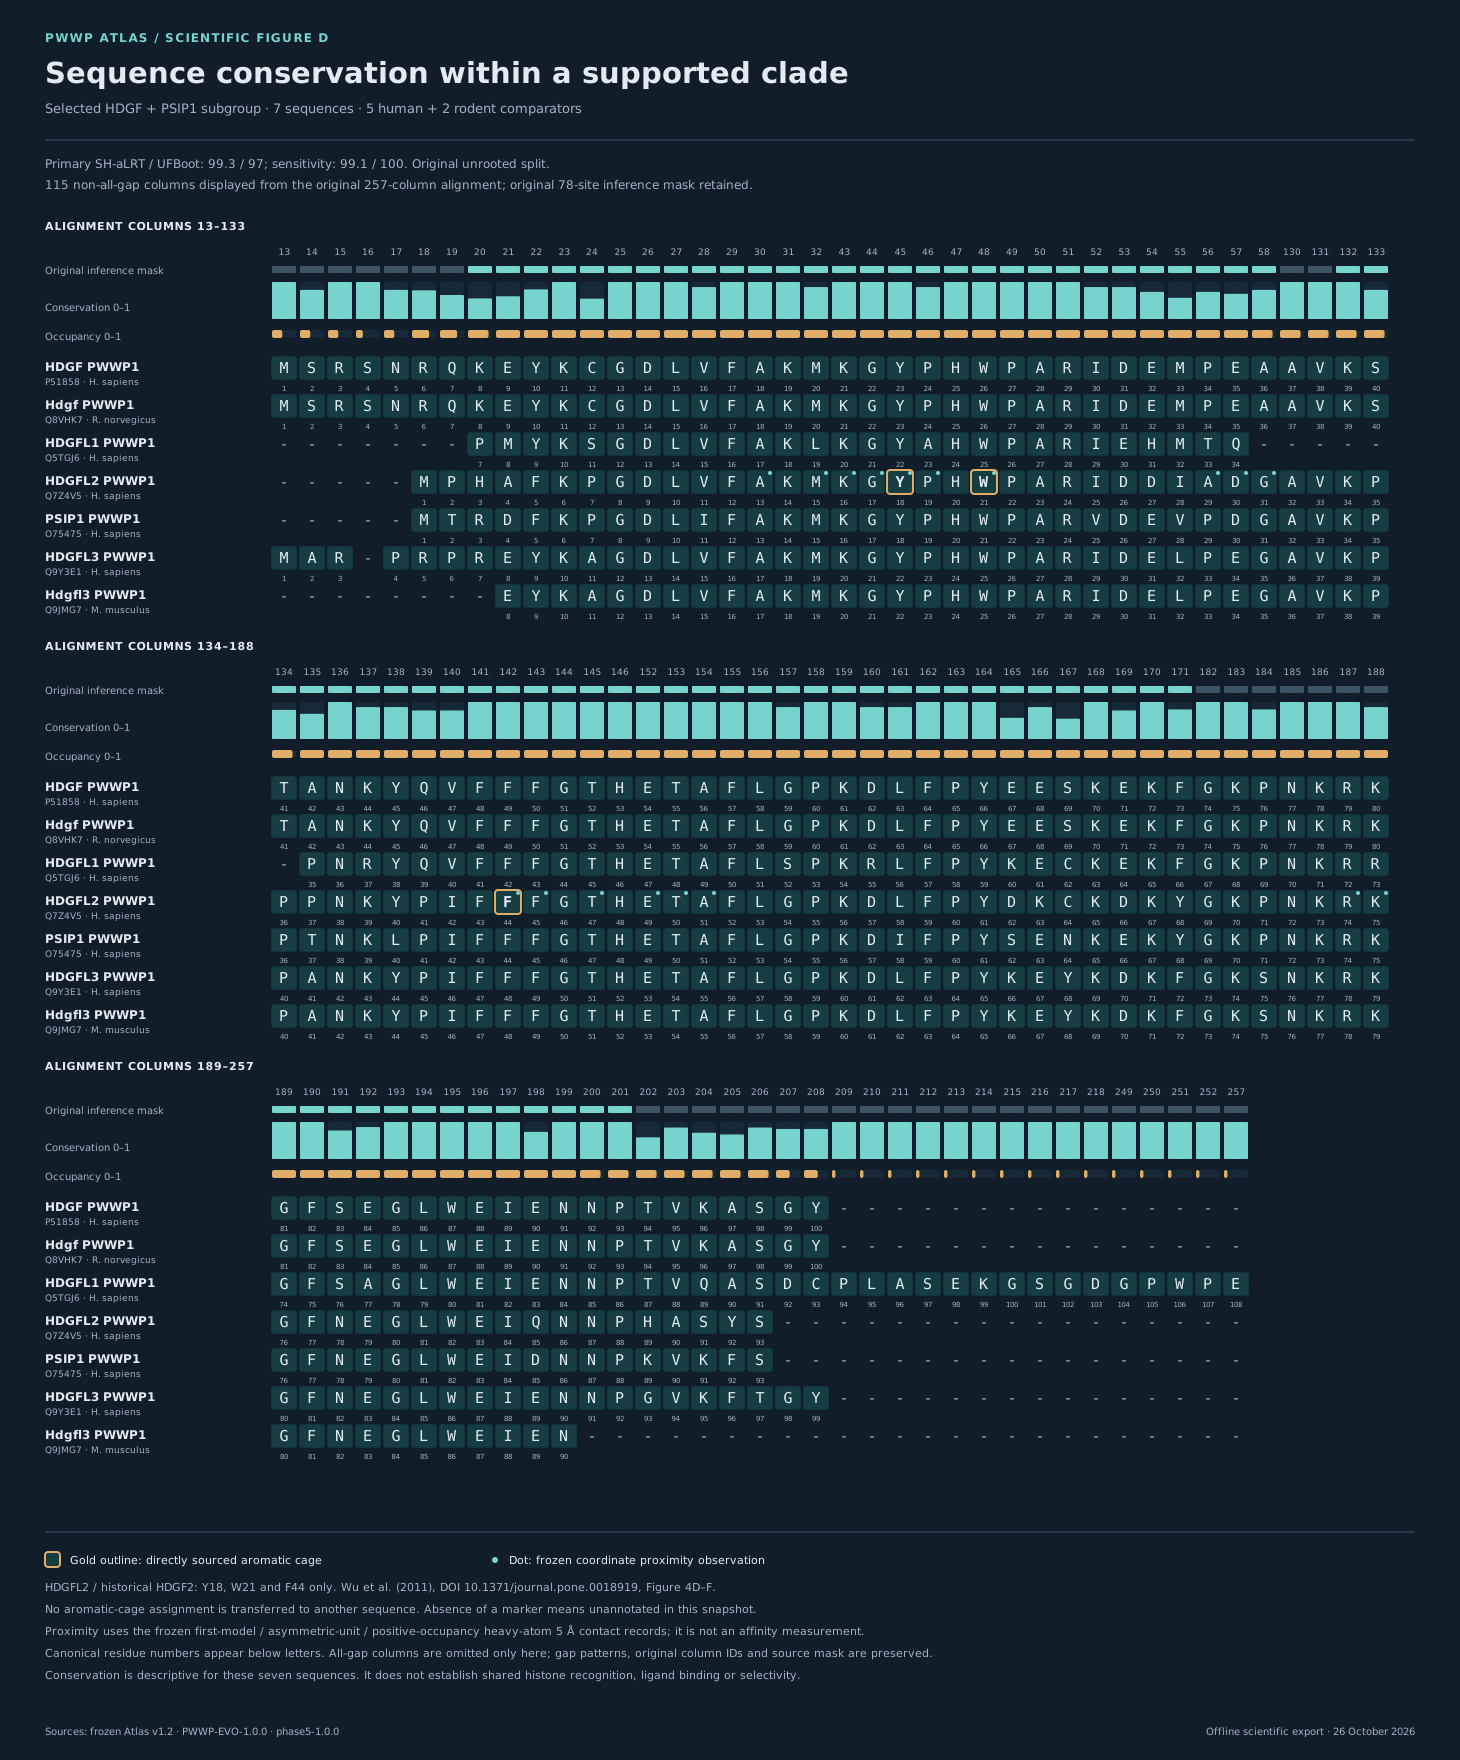
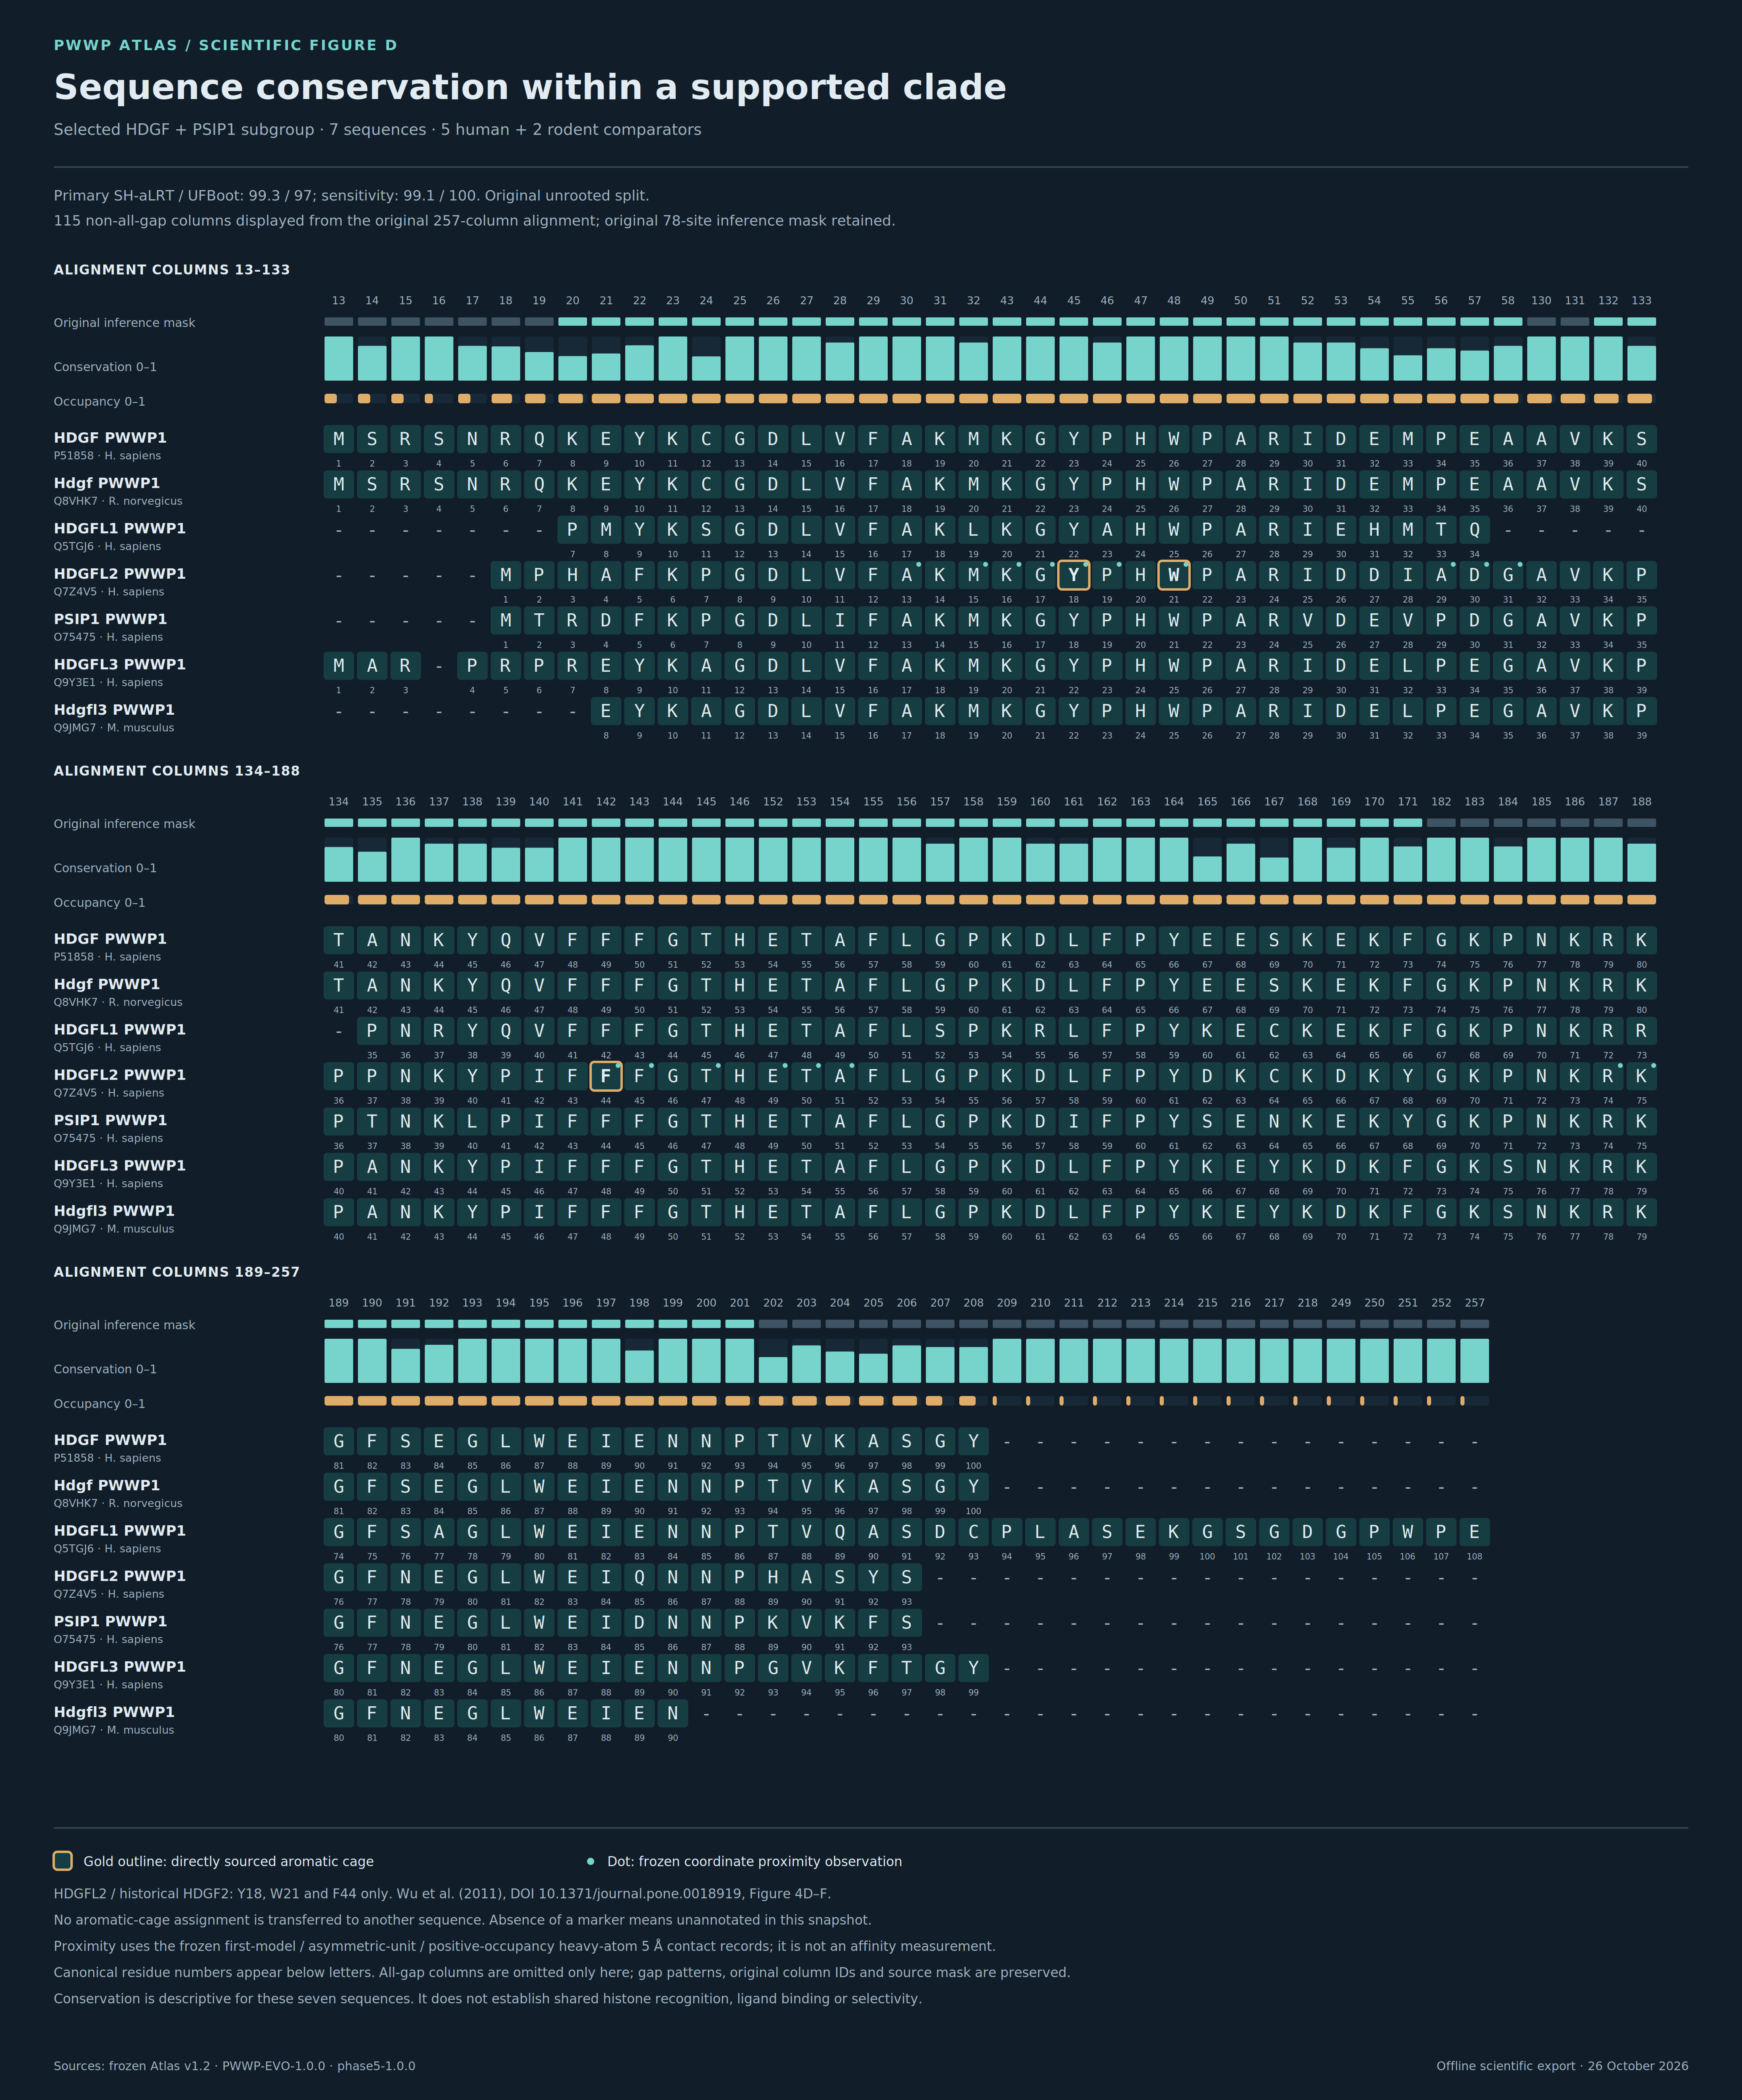
Figure D
Seven HDGF/PSIP1-clade sequences, the original alignment mask, descriptive conservation, source cage annotations and deposited contacts.
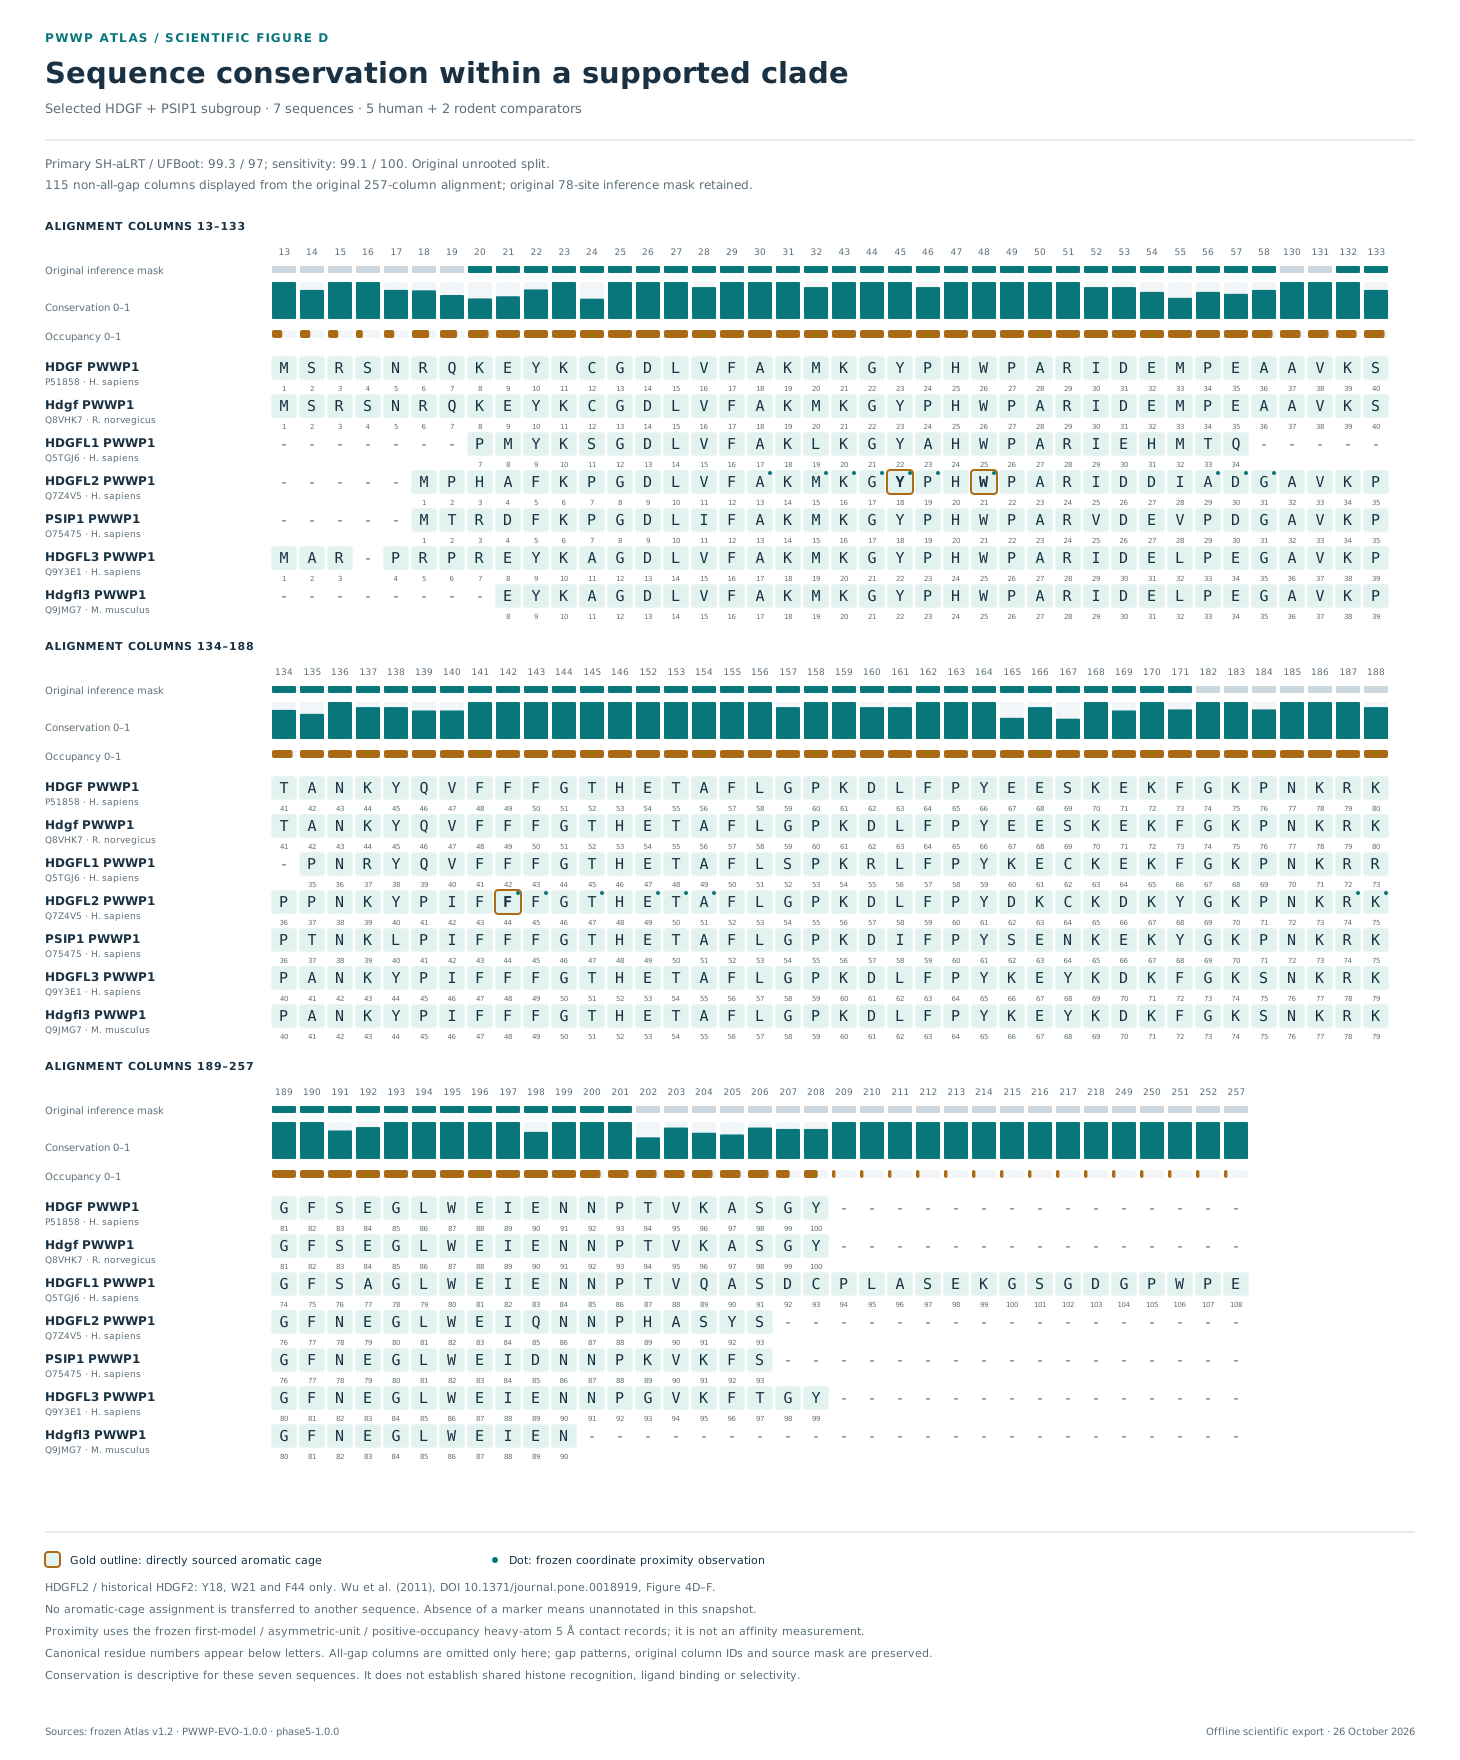
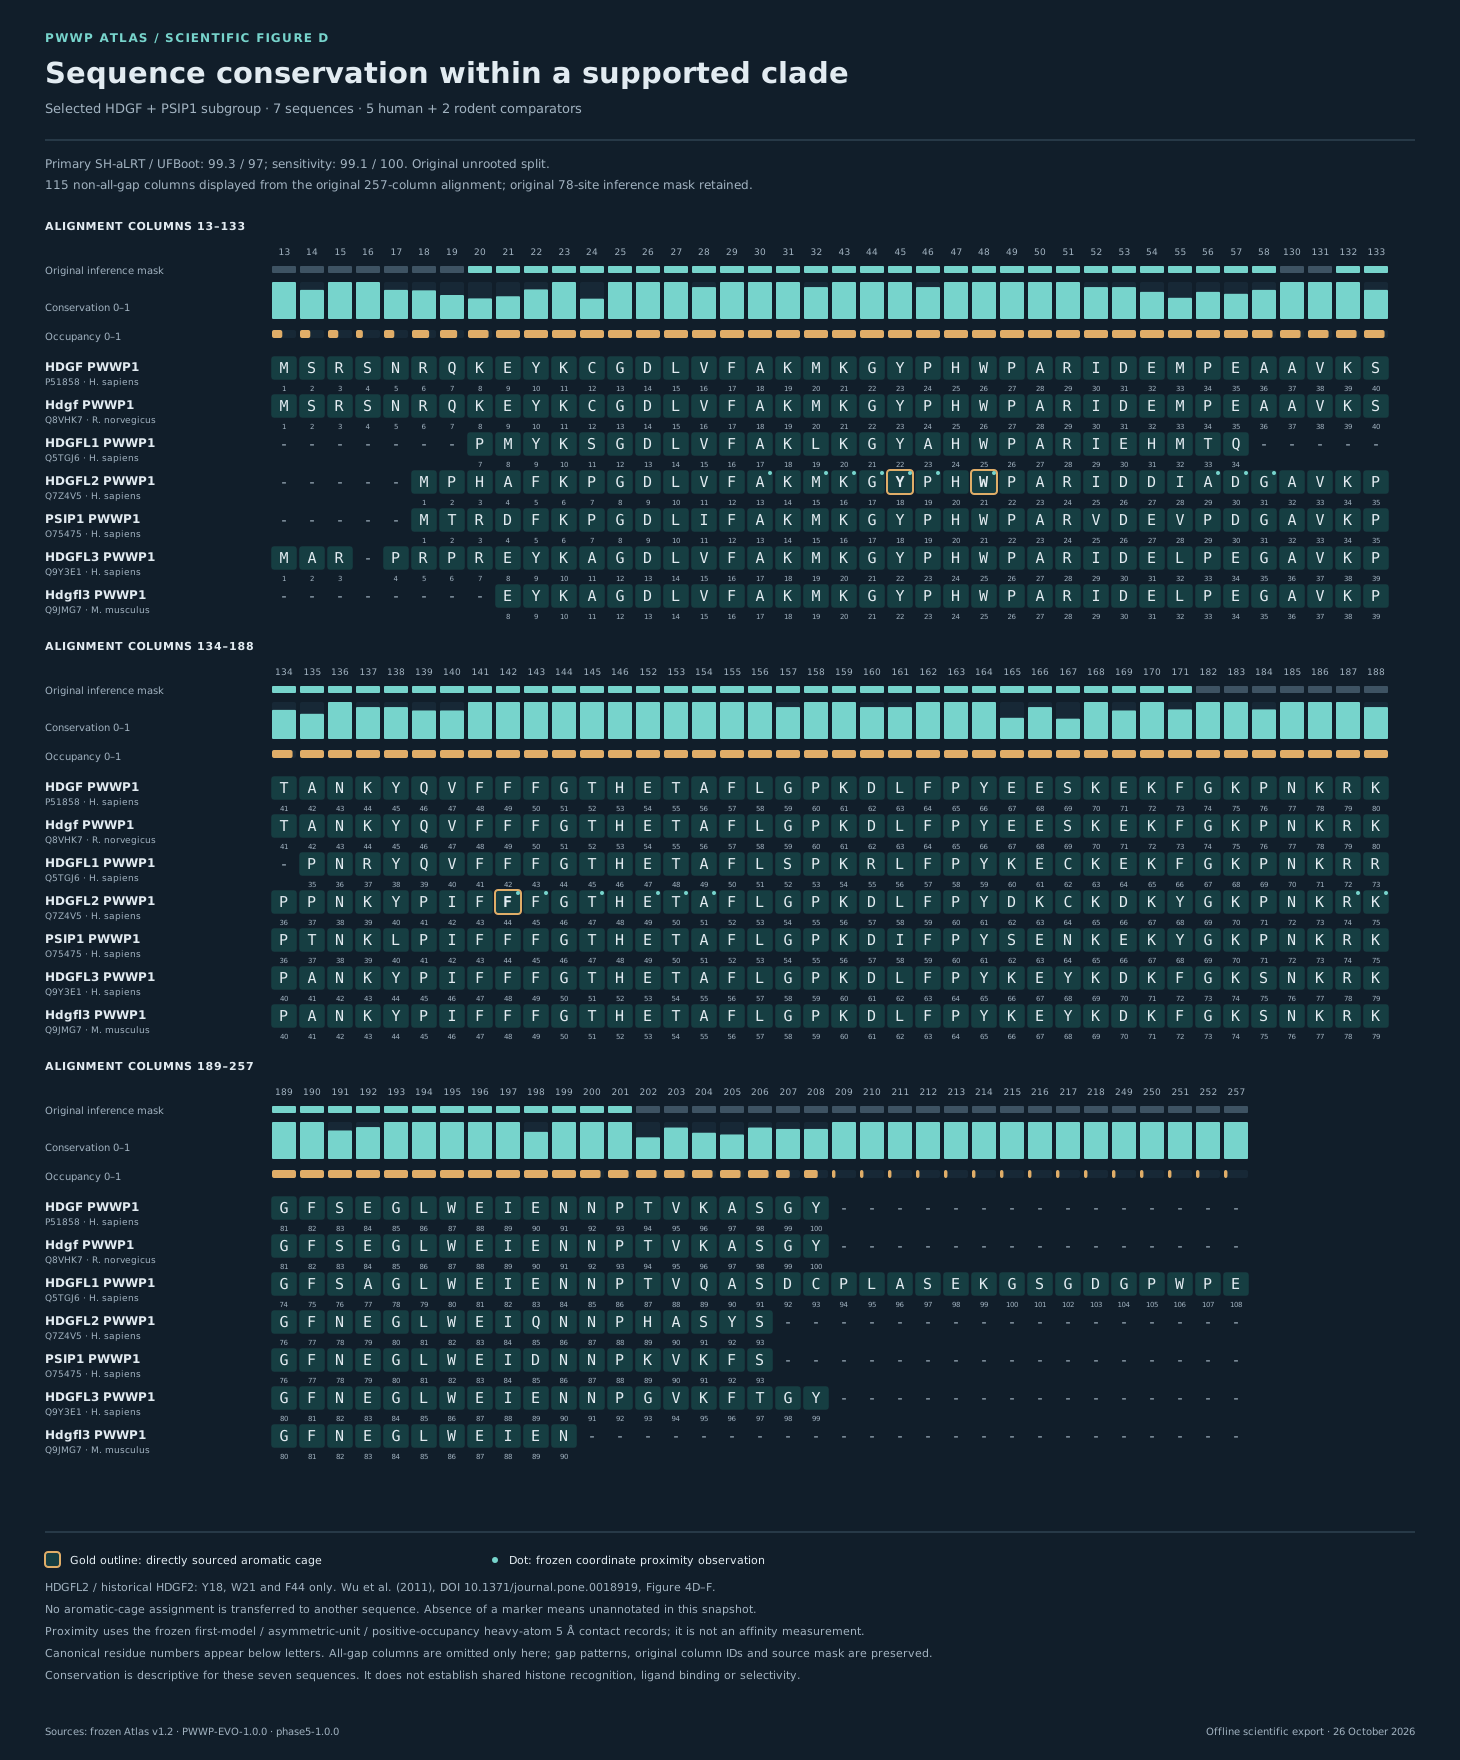
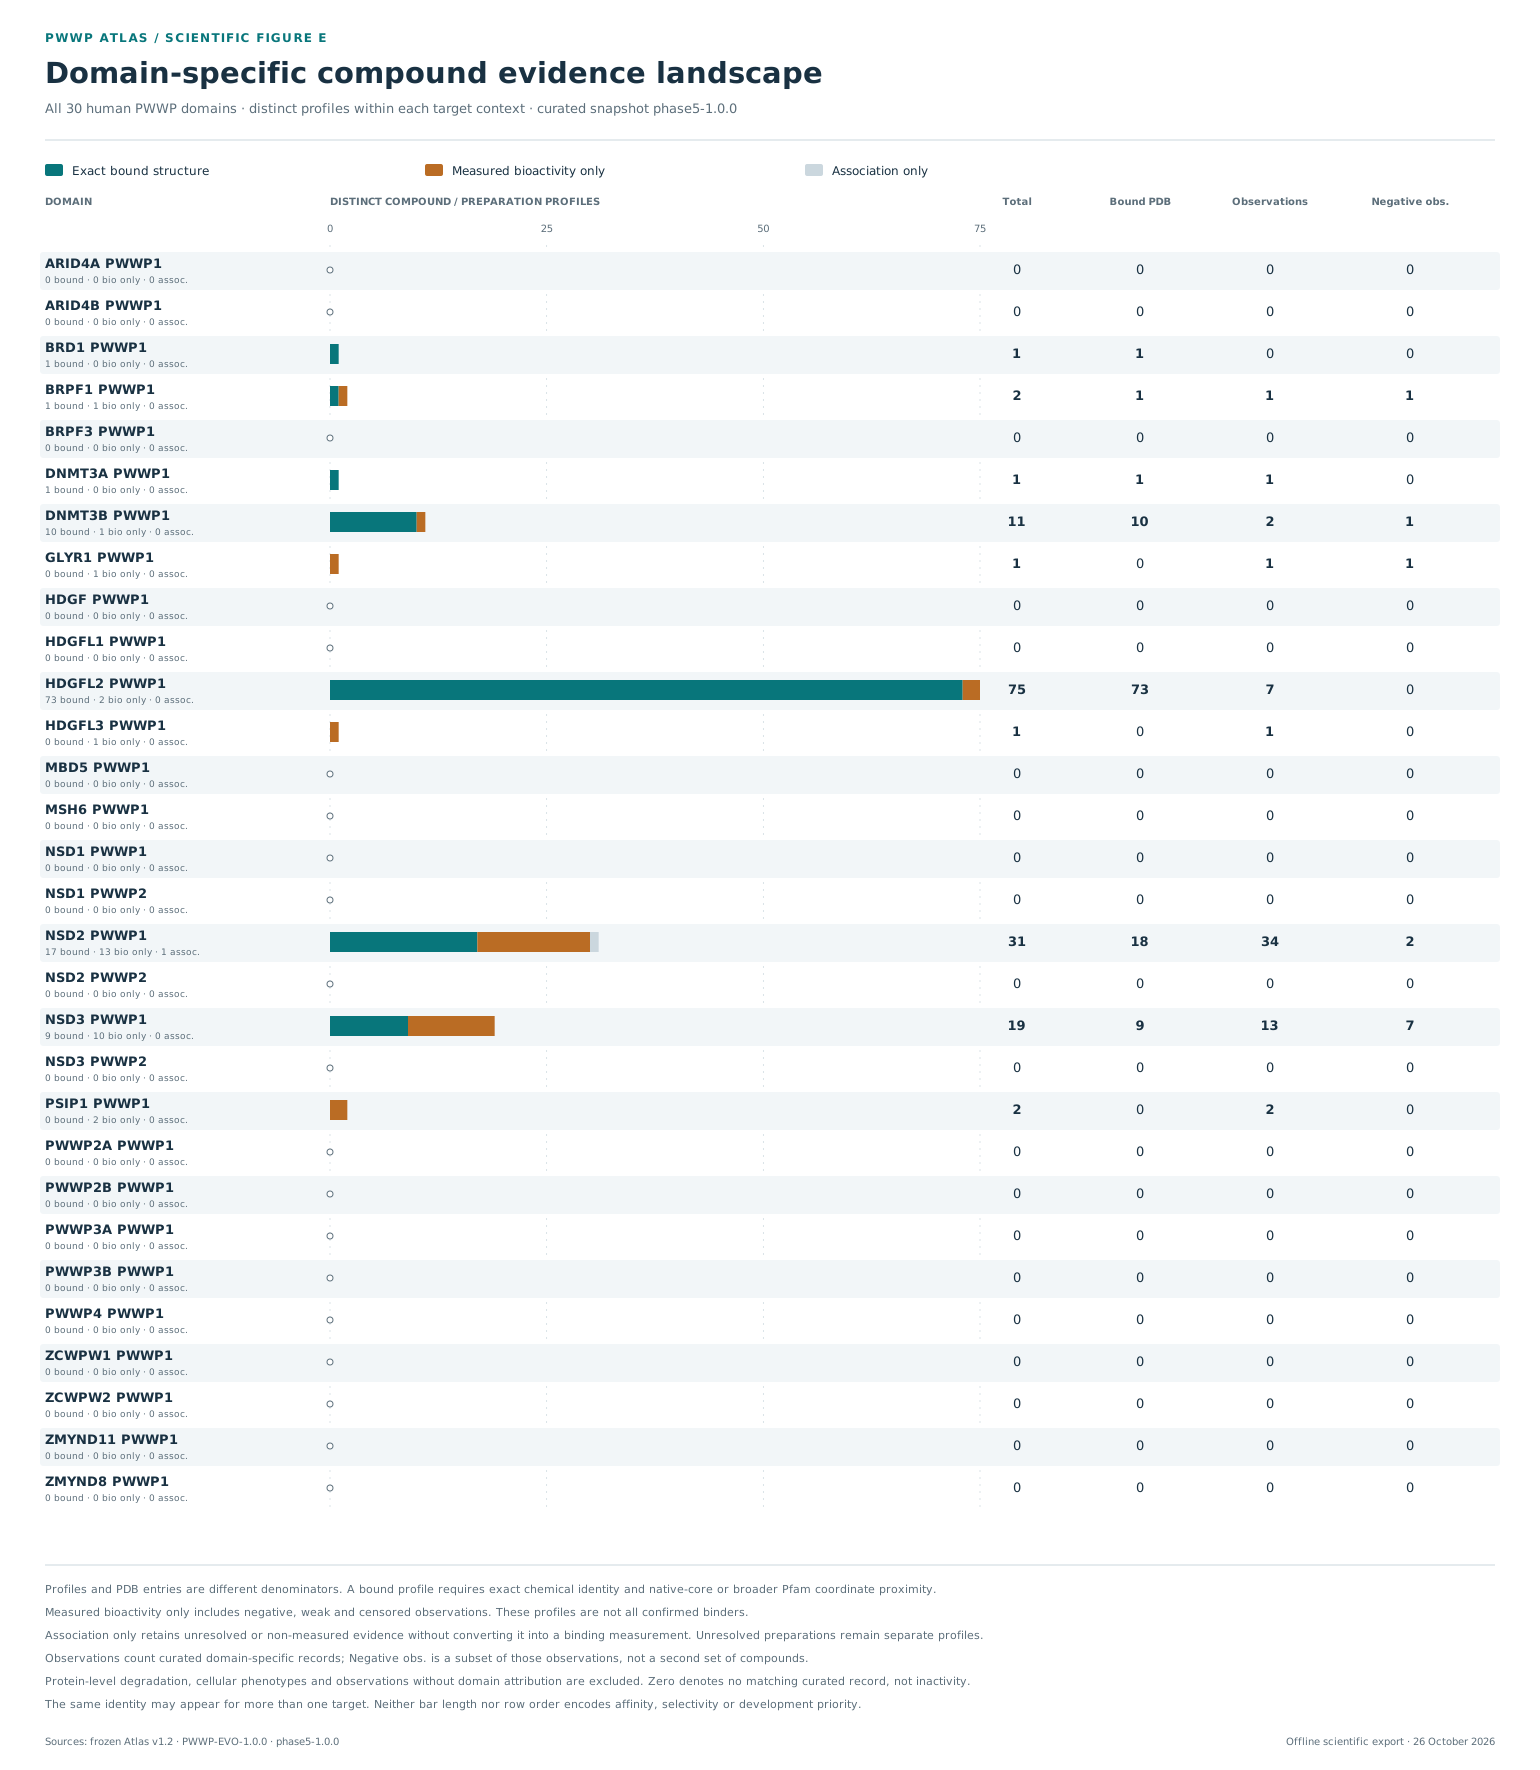
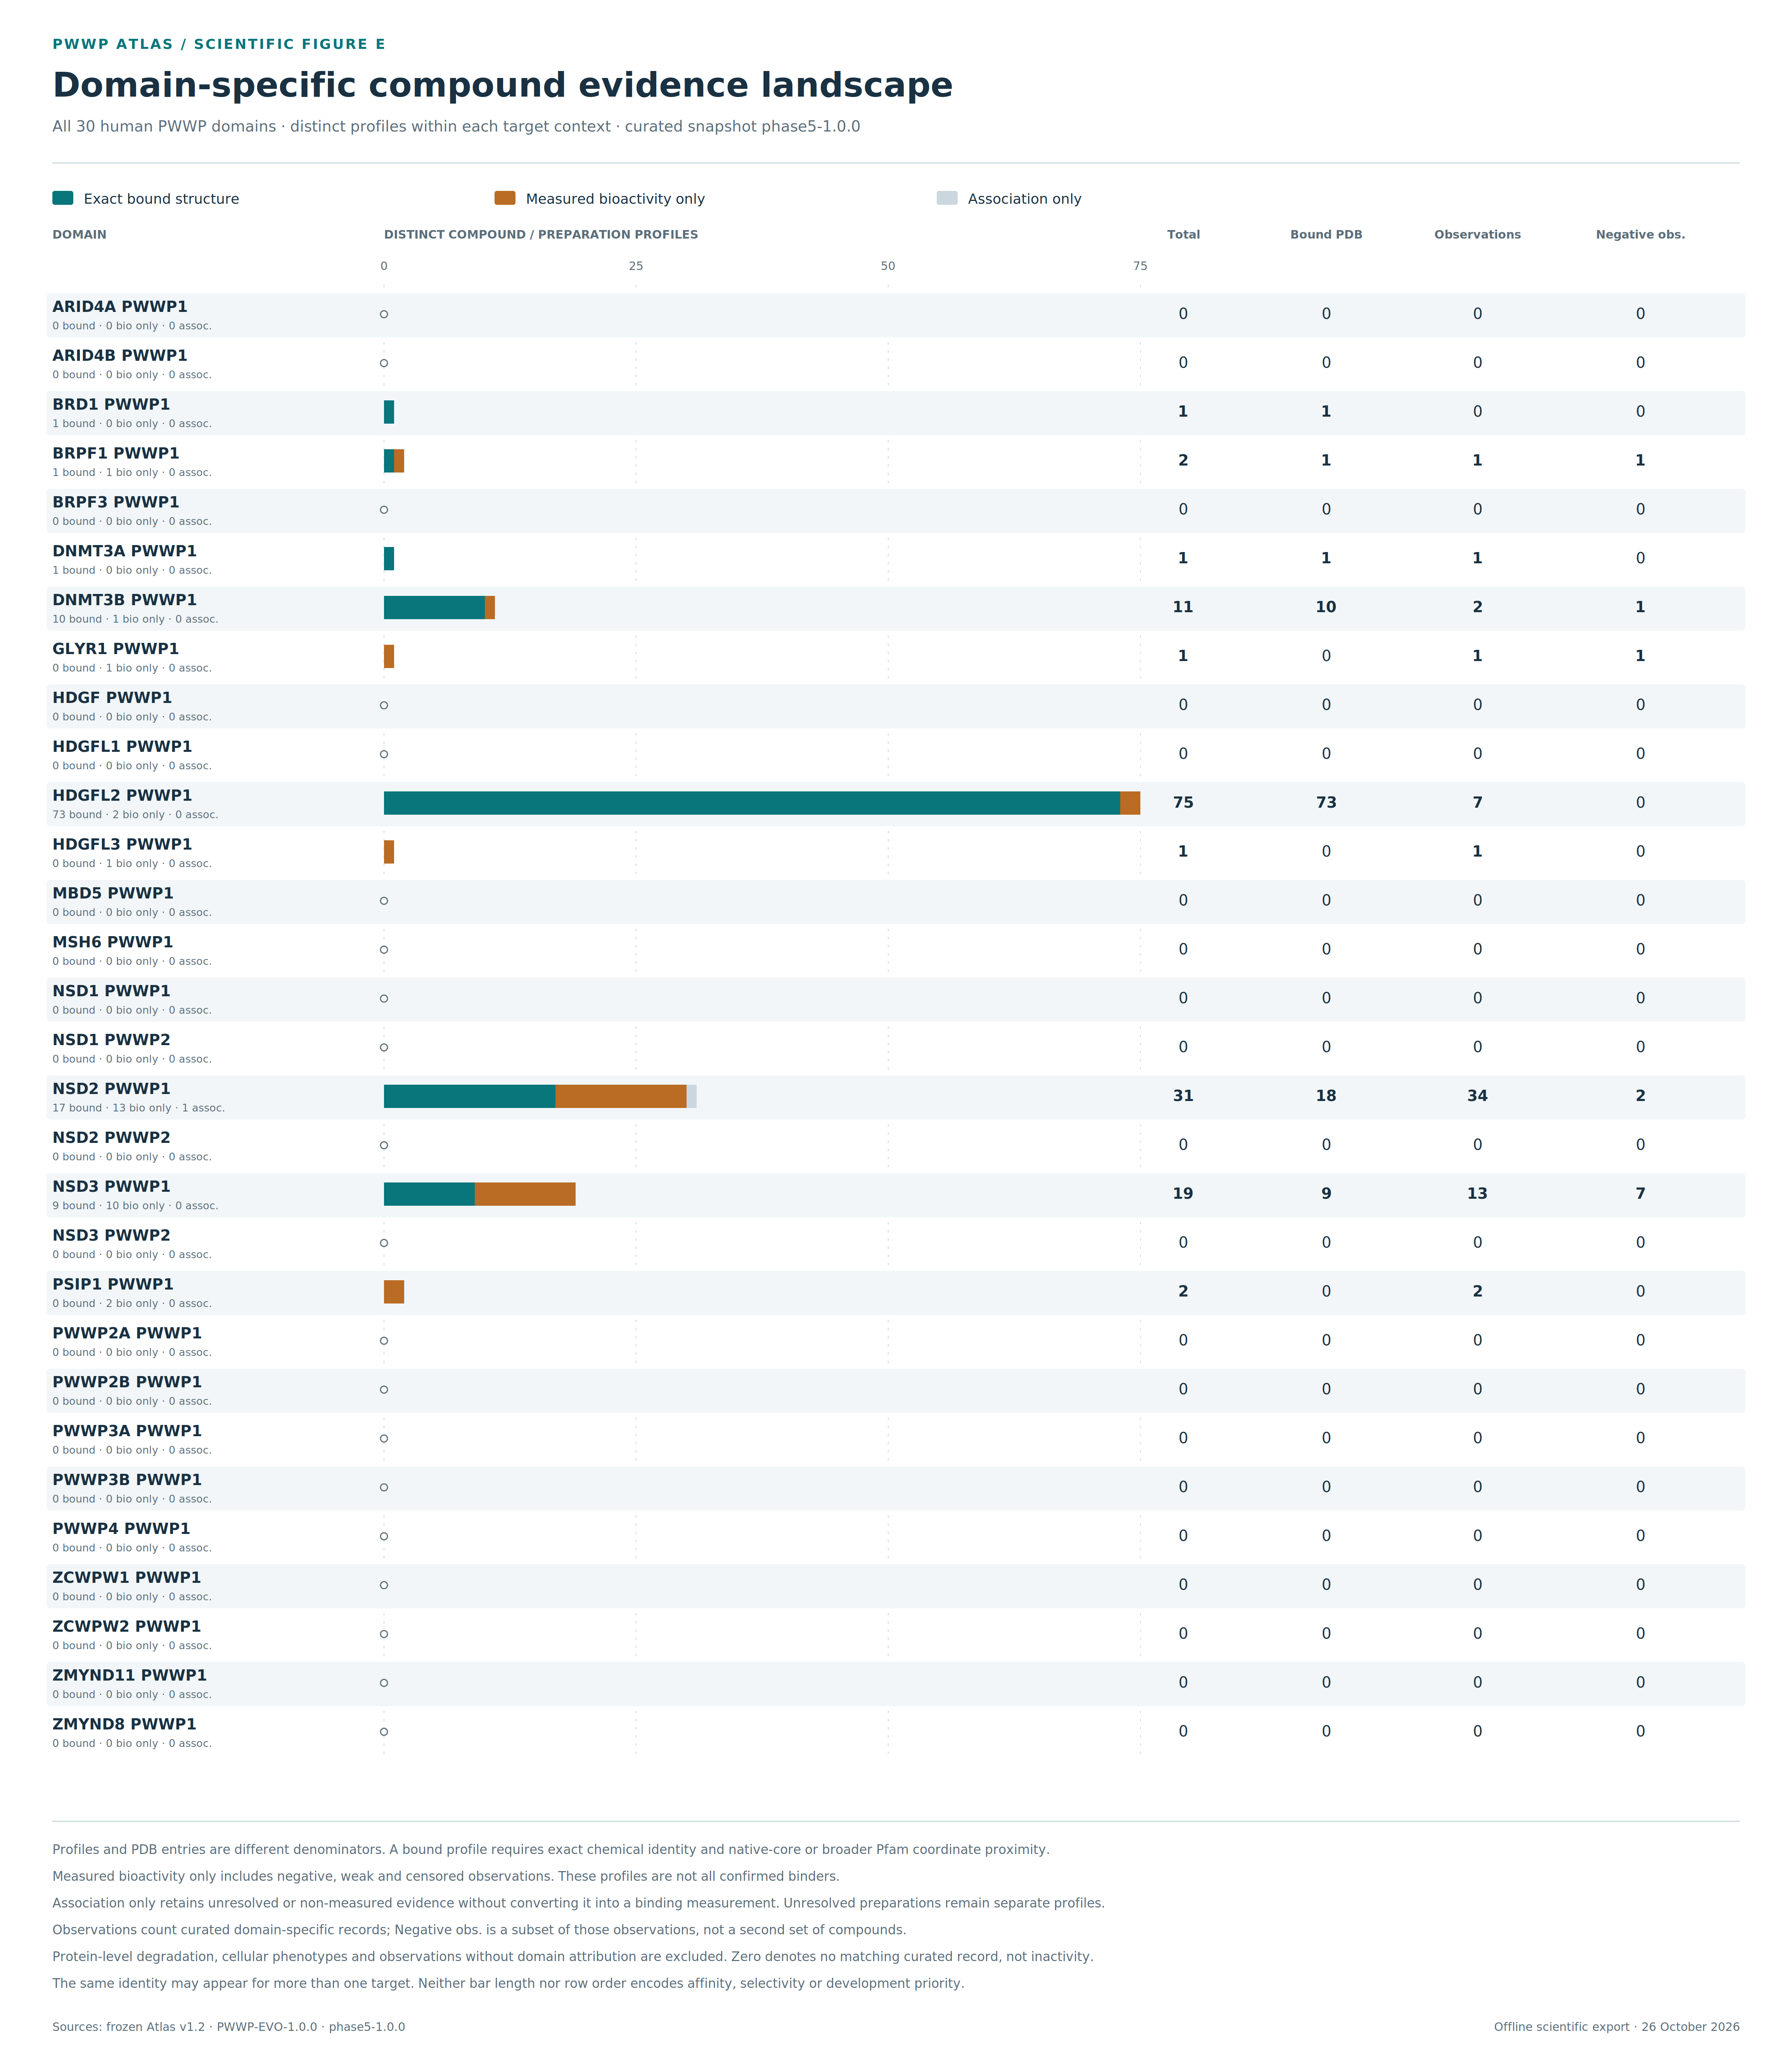
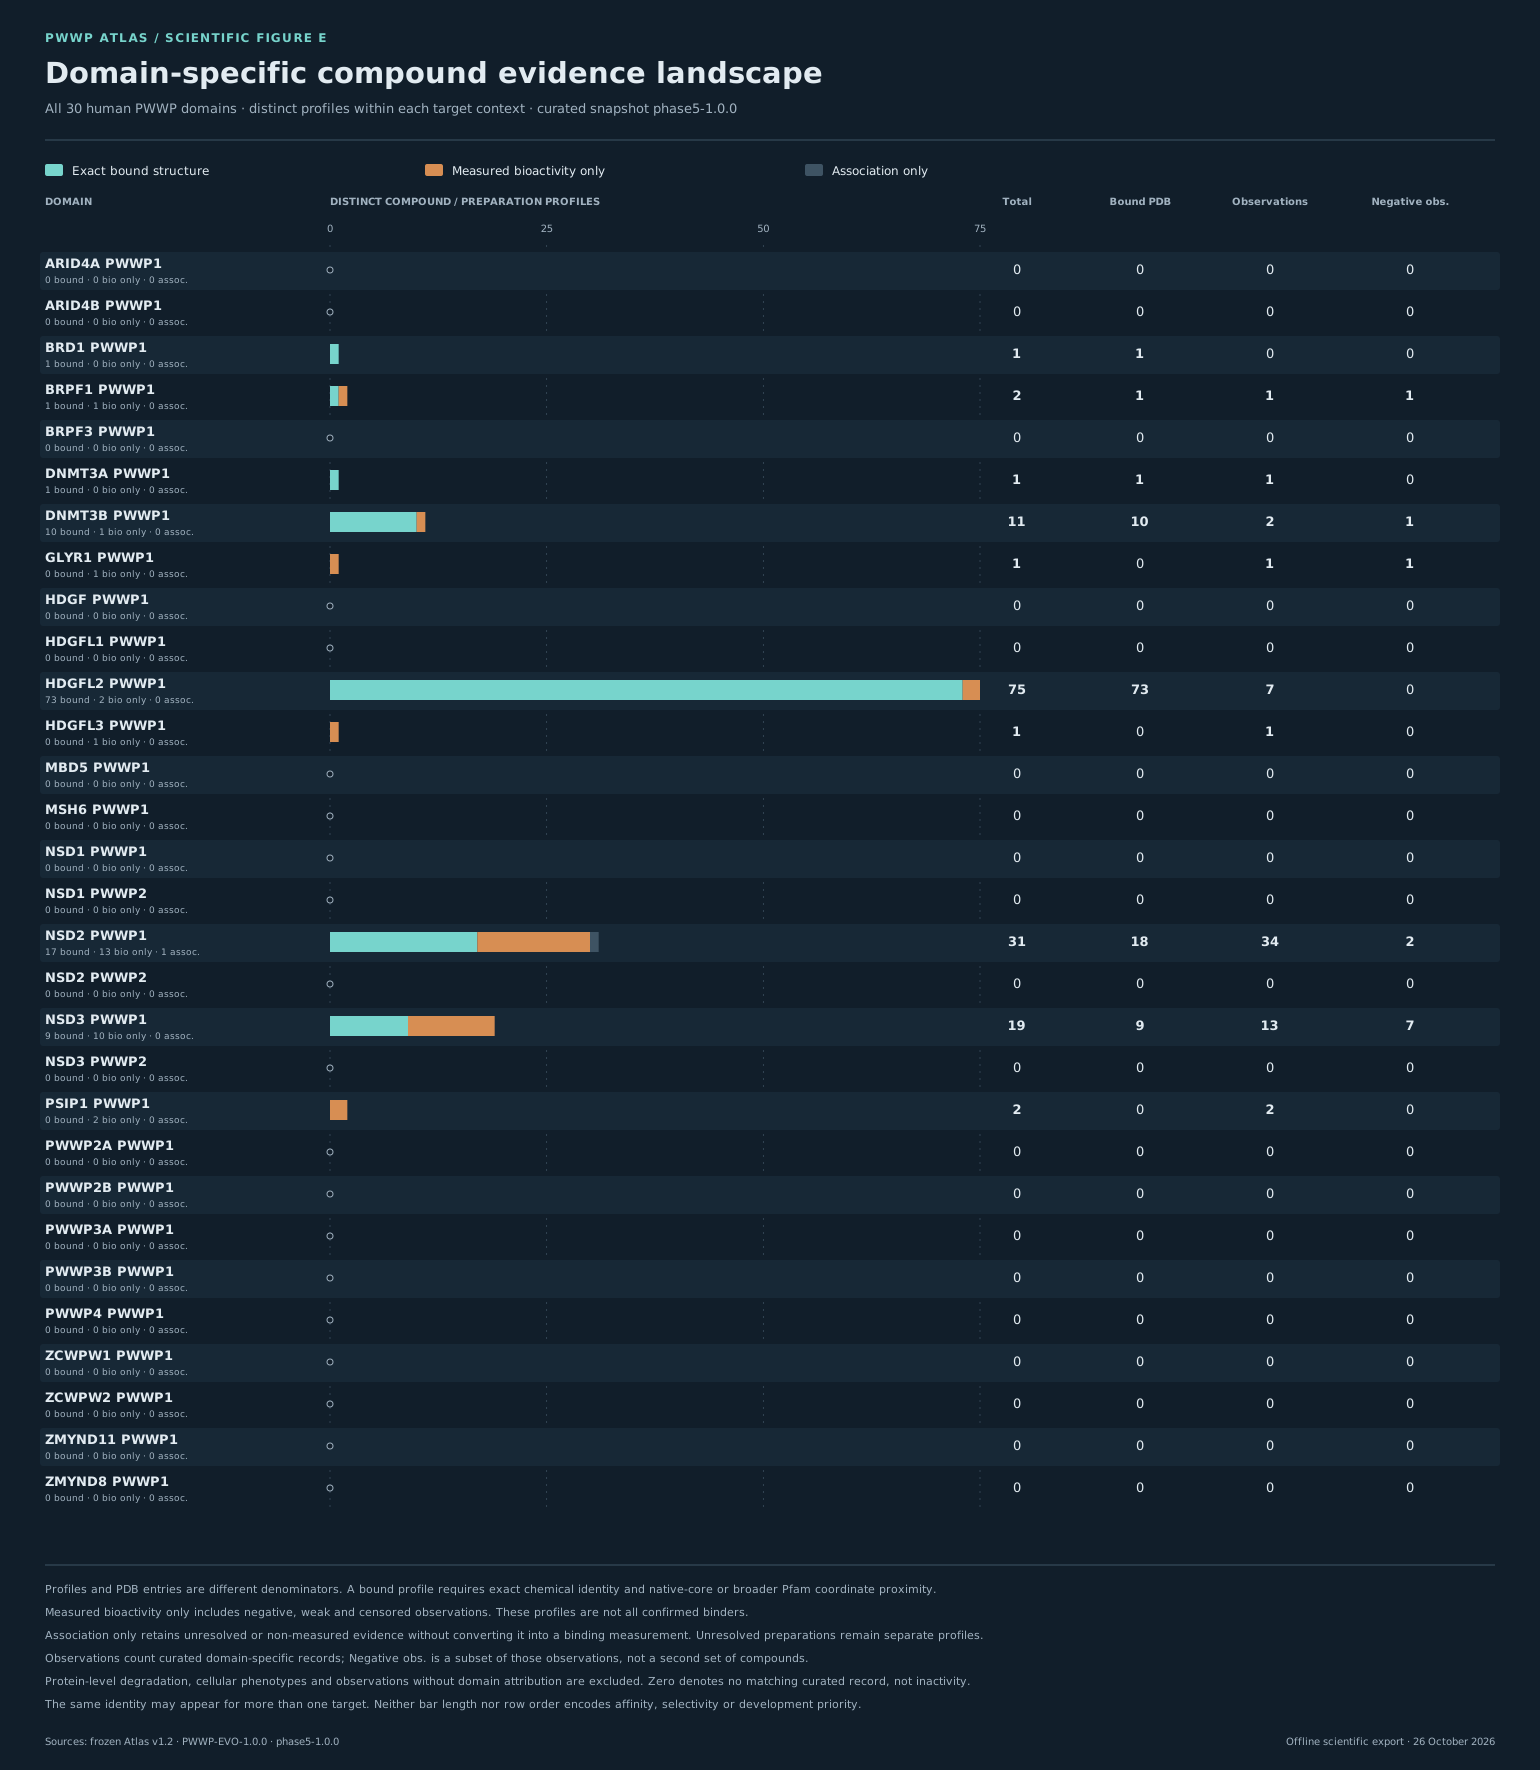
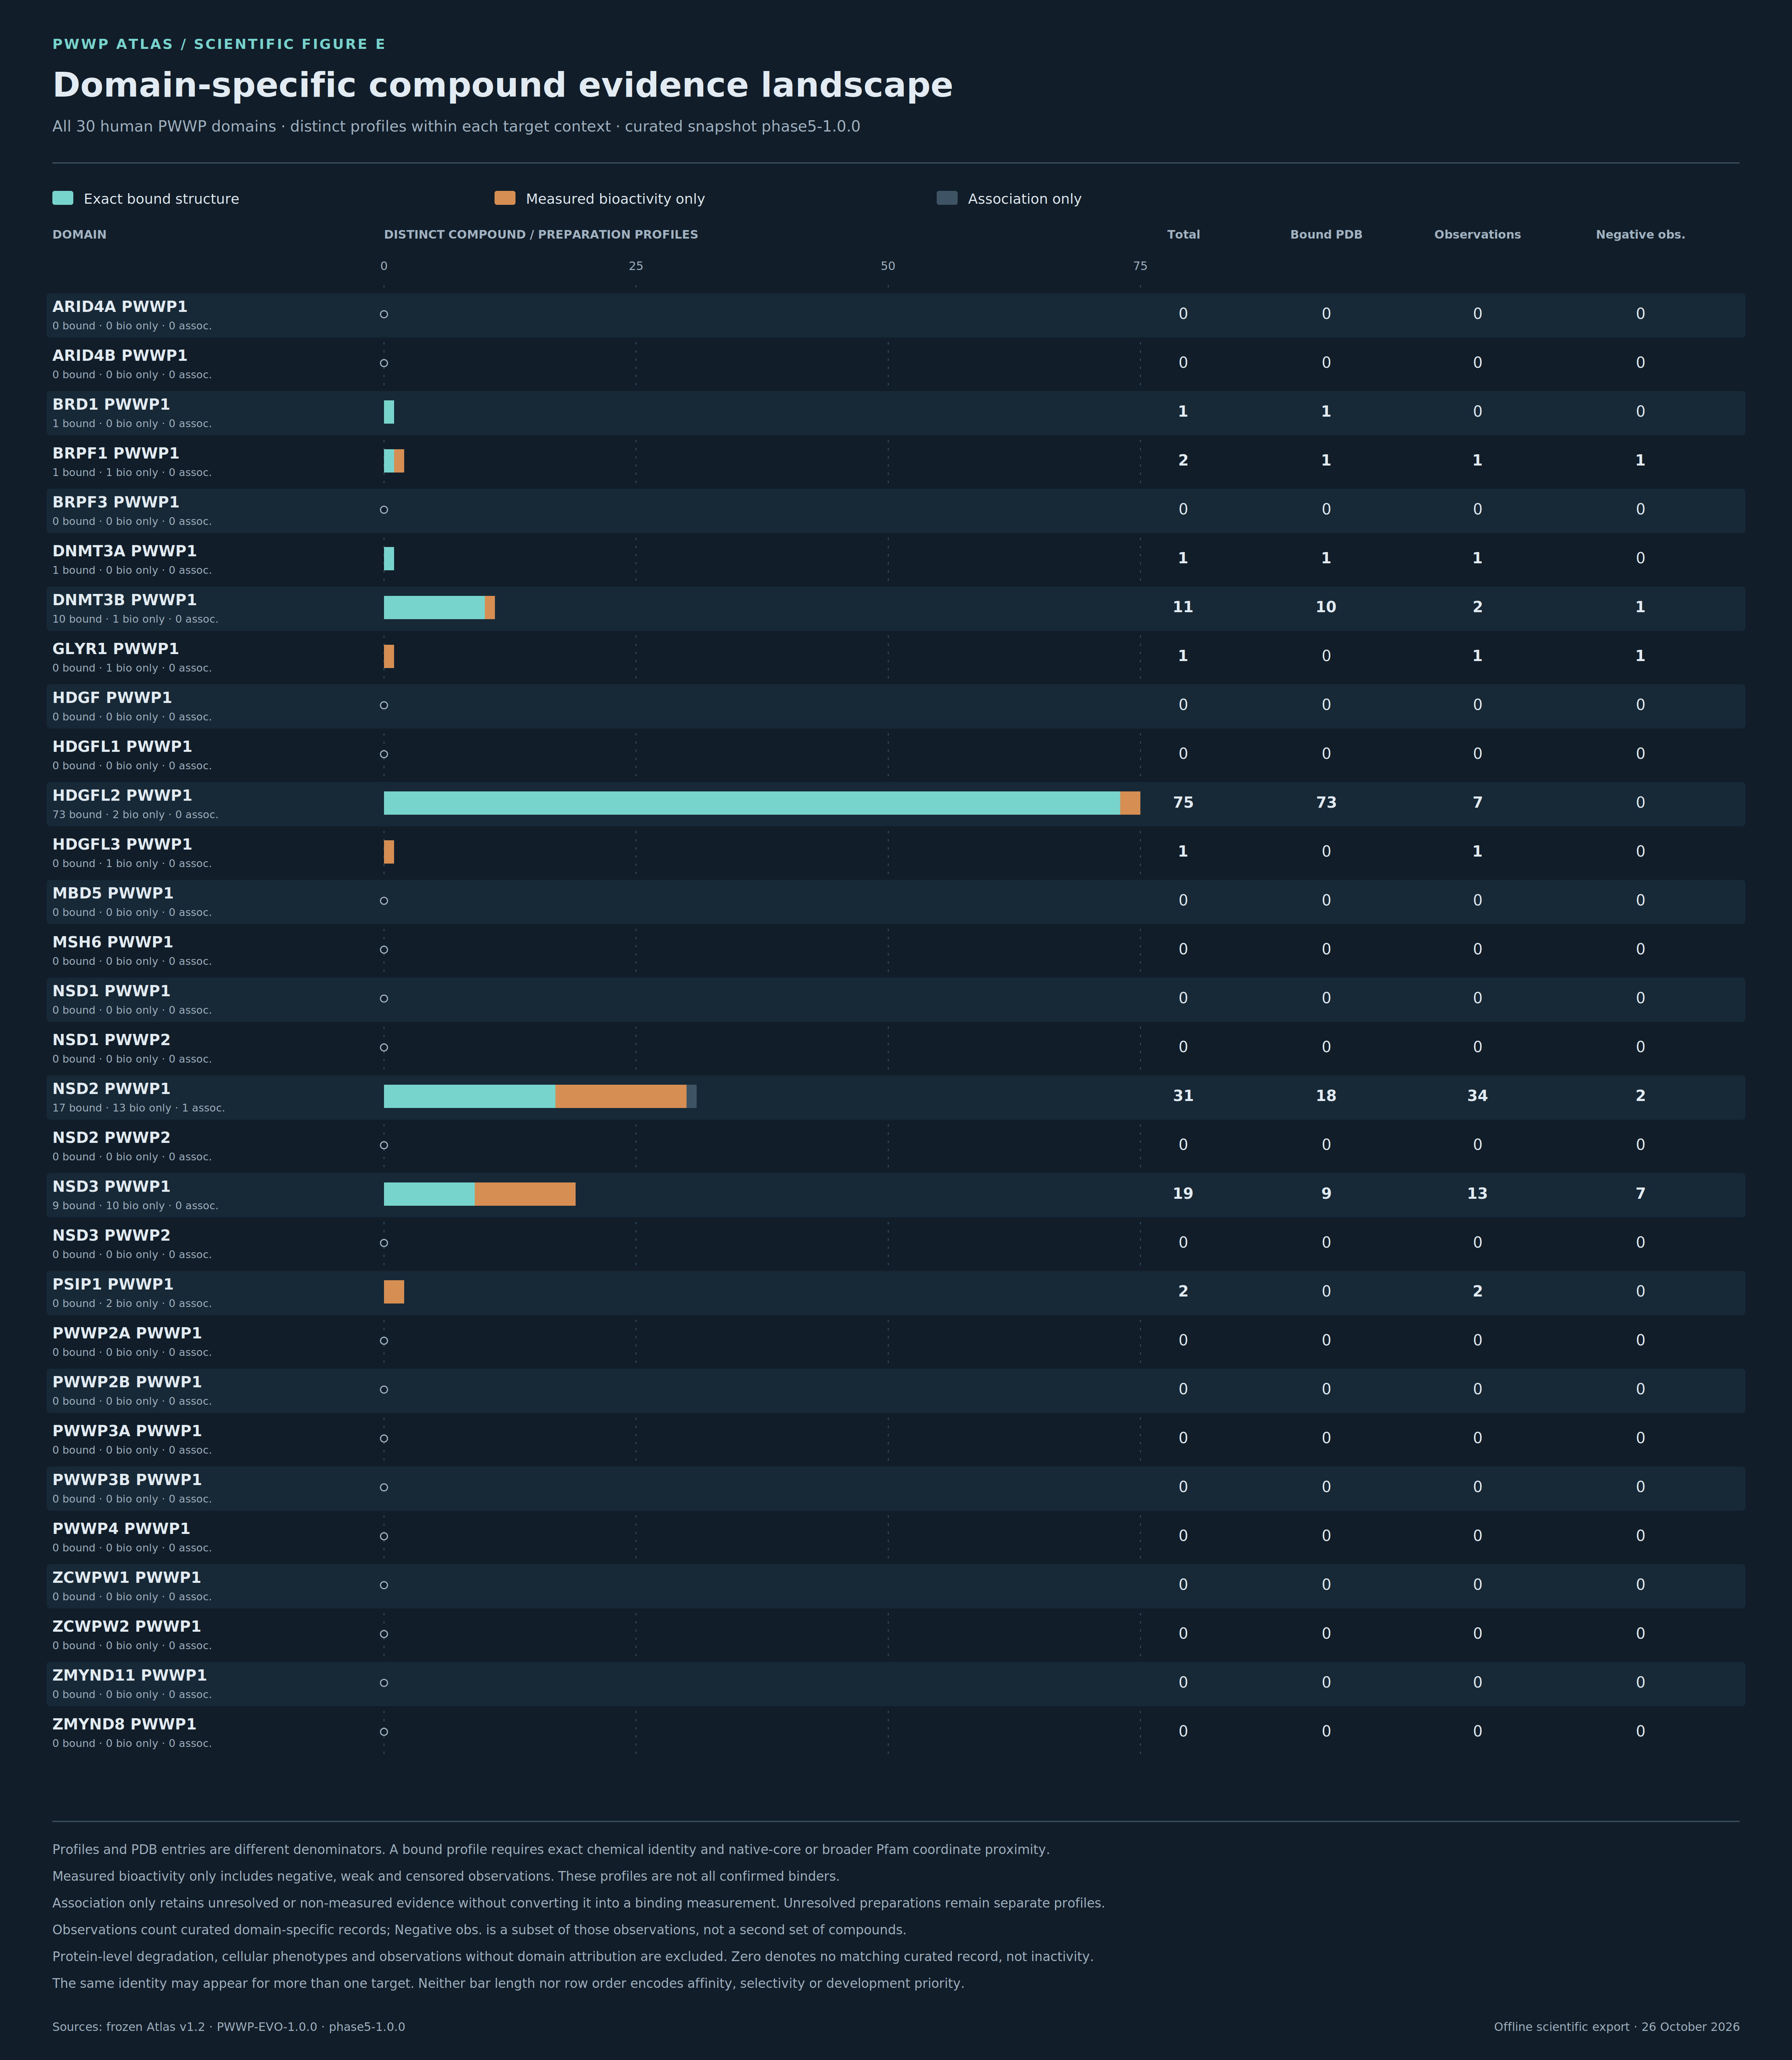
Figure E
Thirty human domain rows with separate exact-bound, measured-bioactivity-only and association-only profile counts.
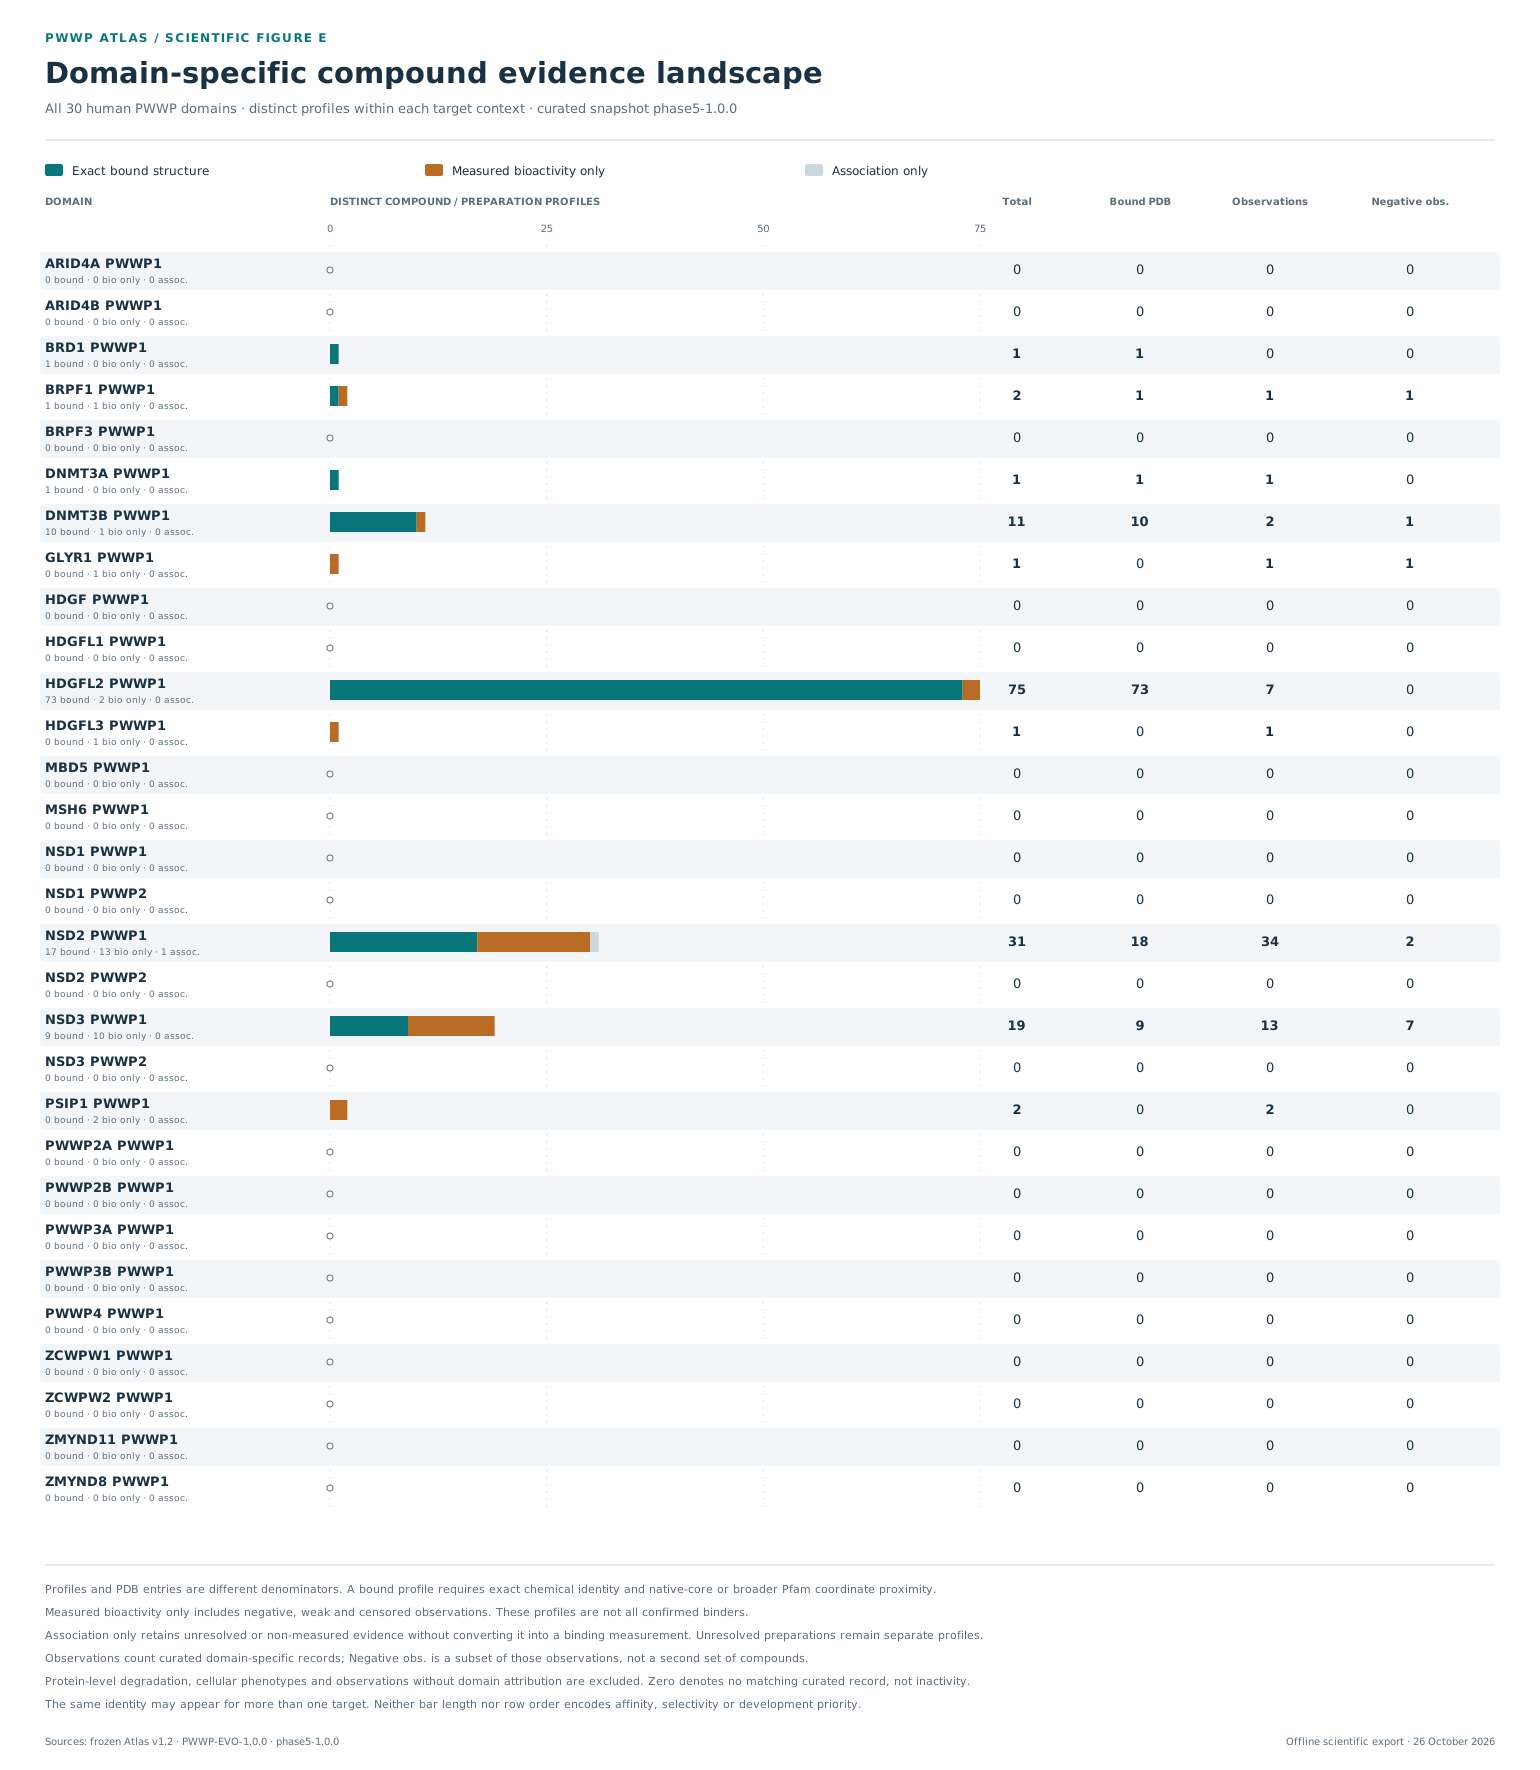
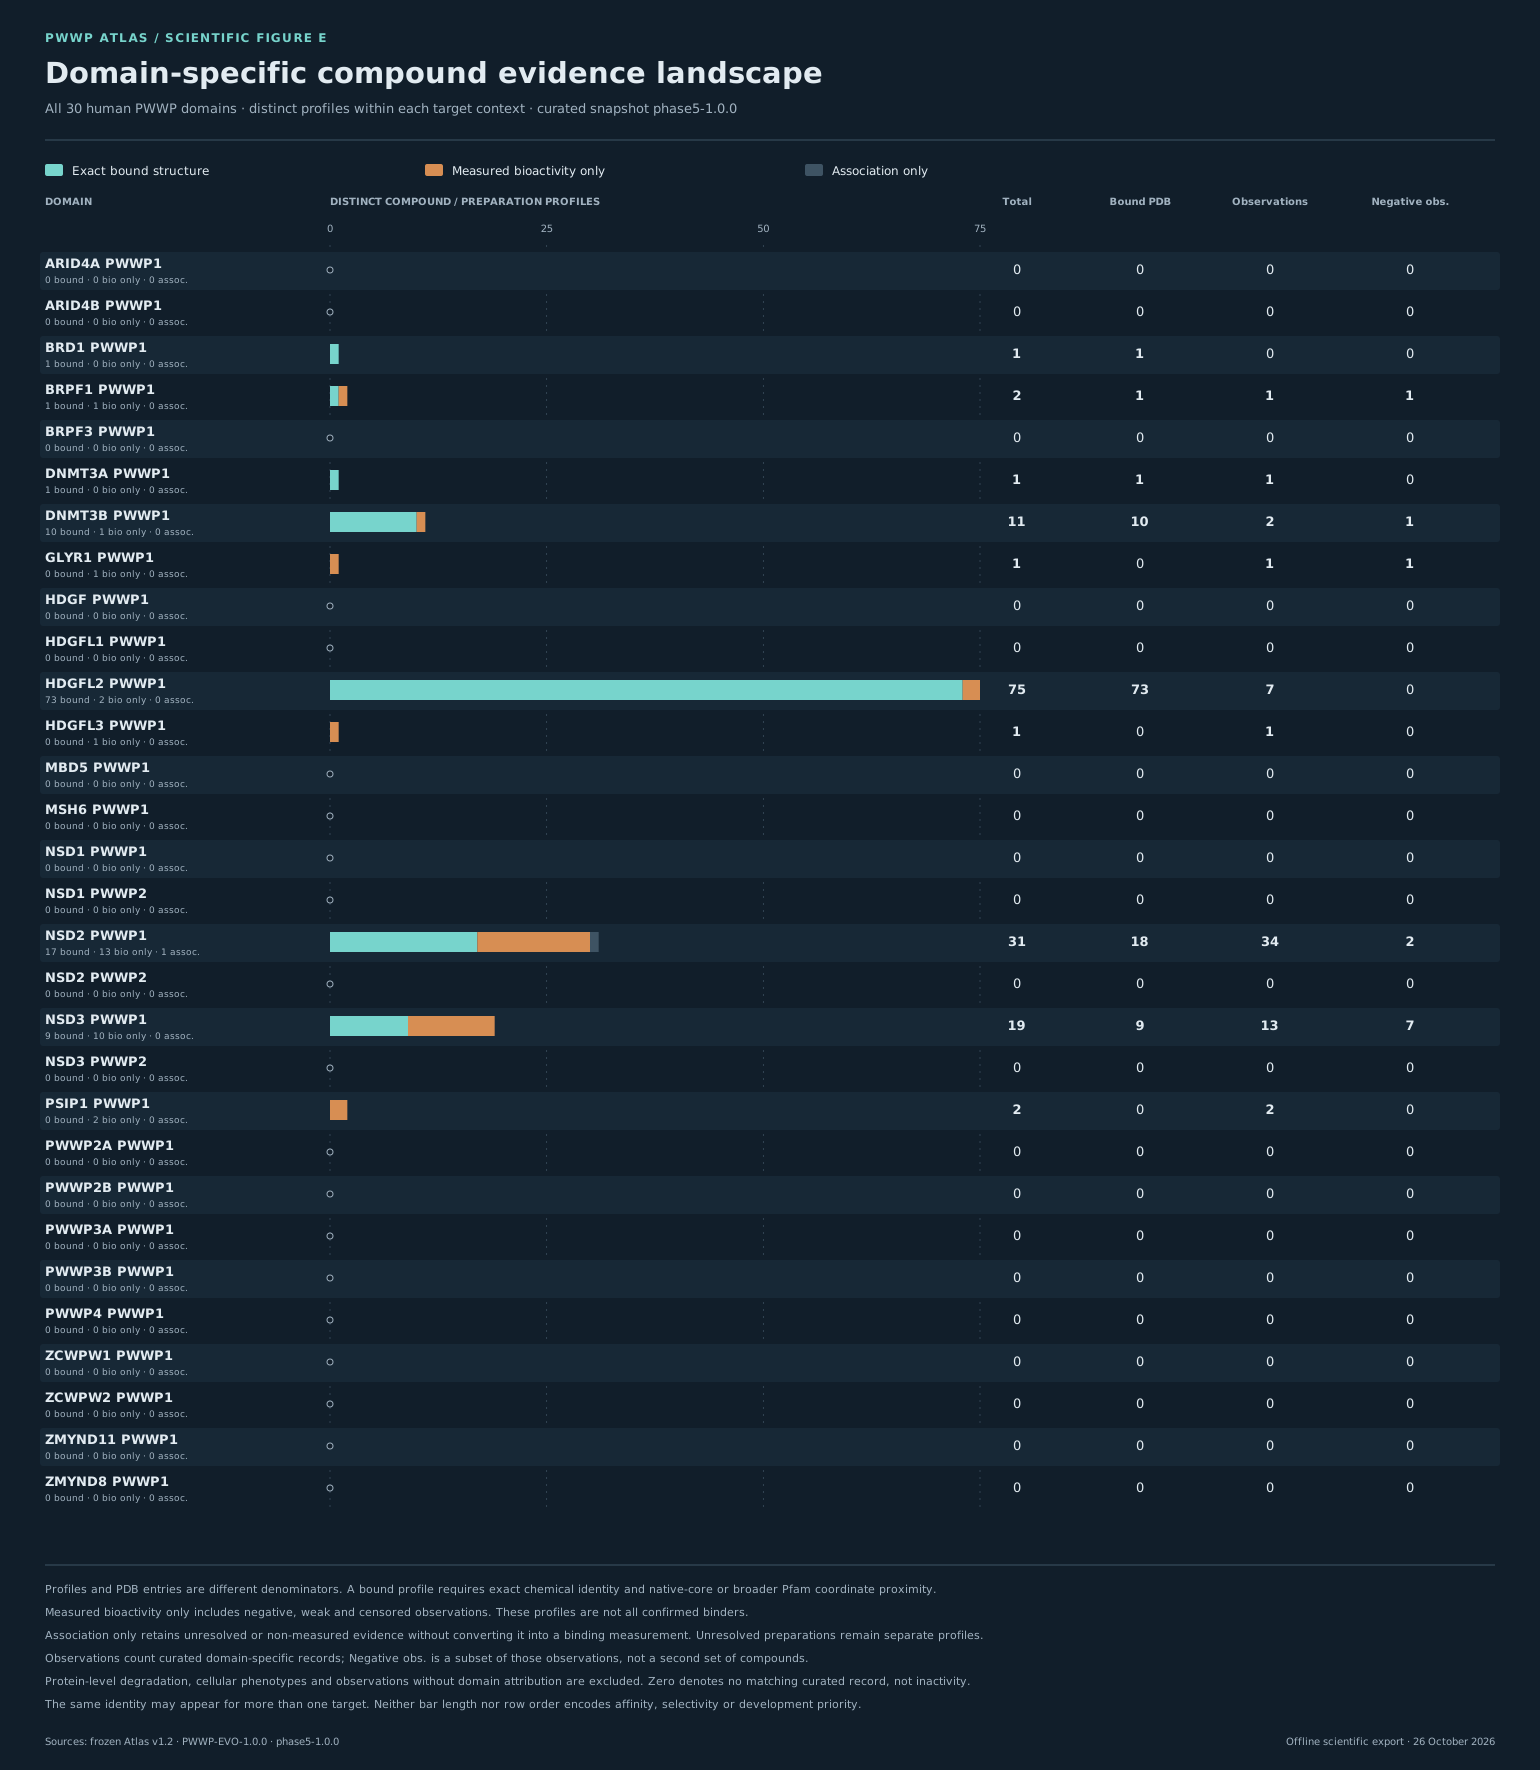
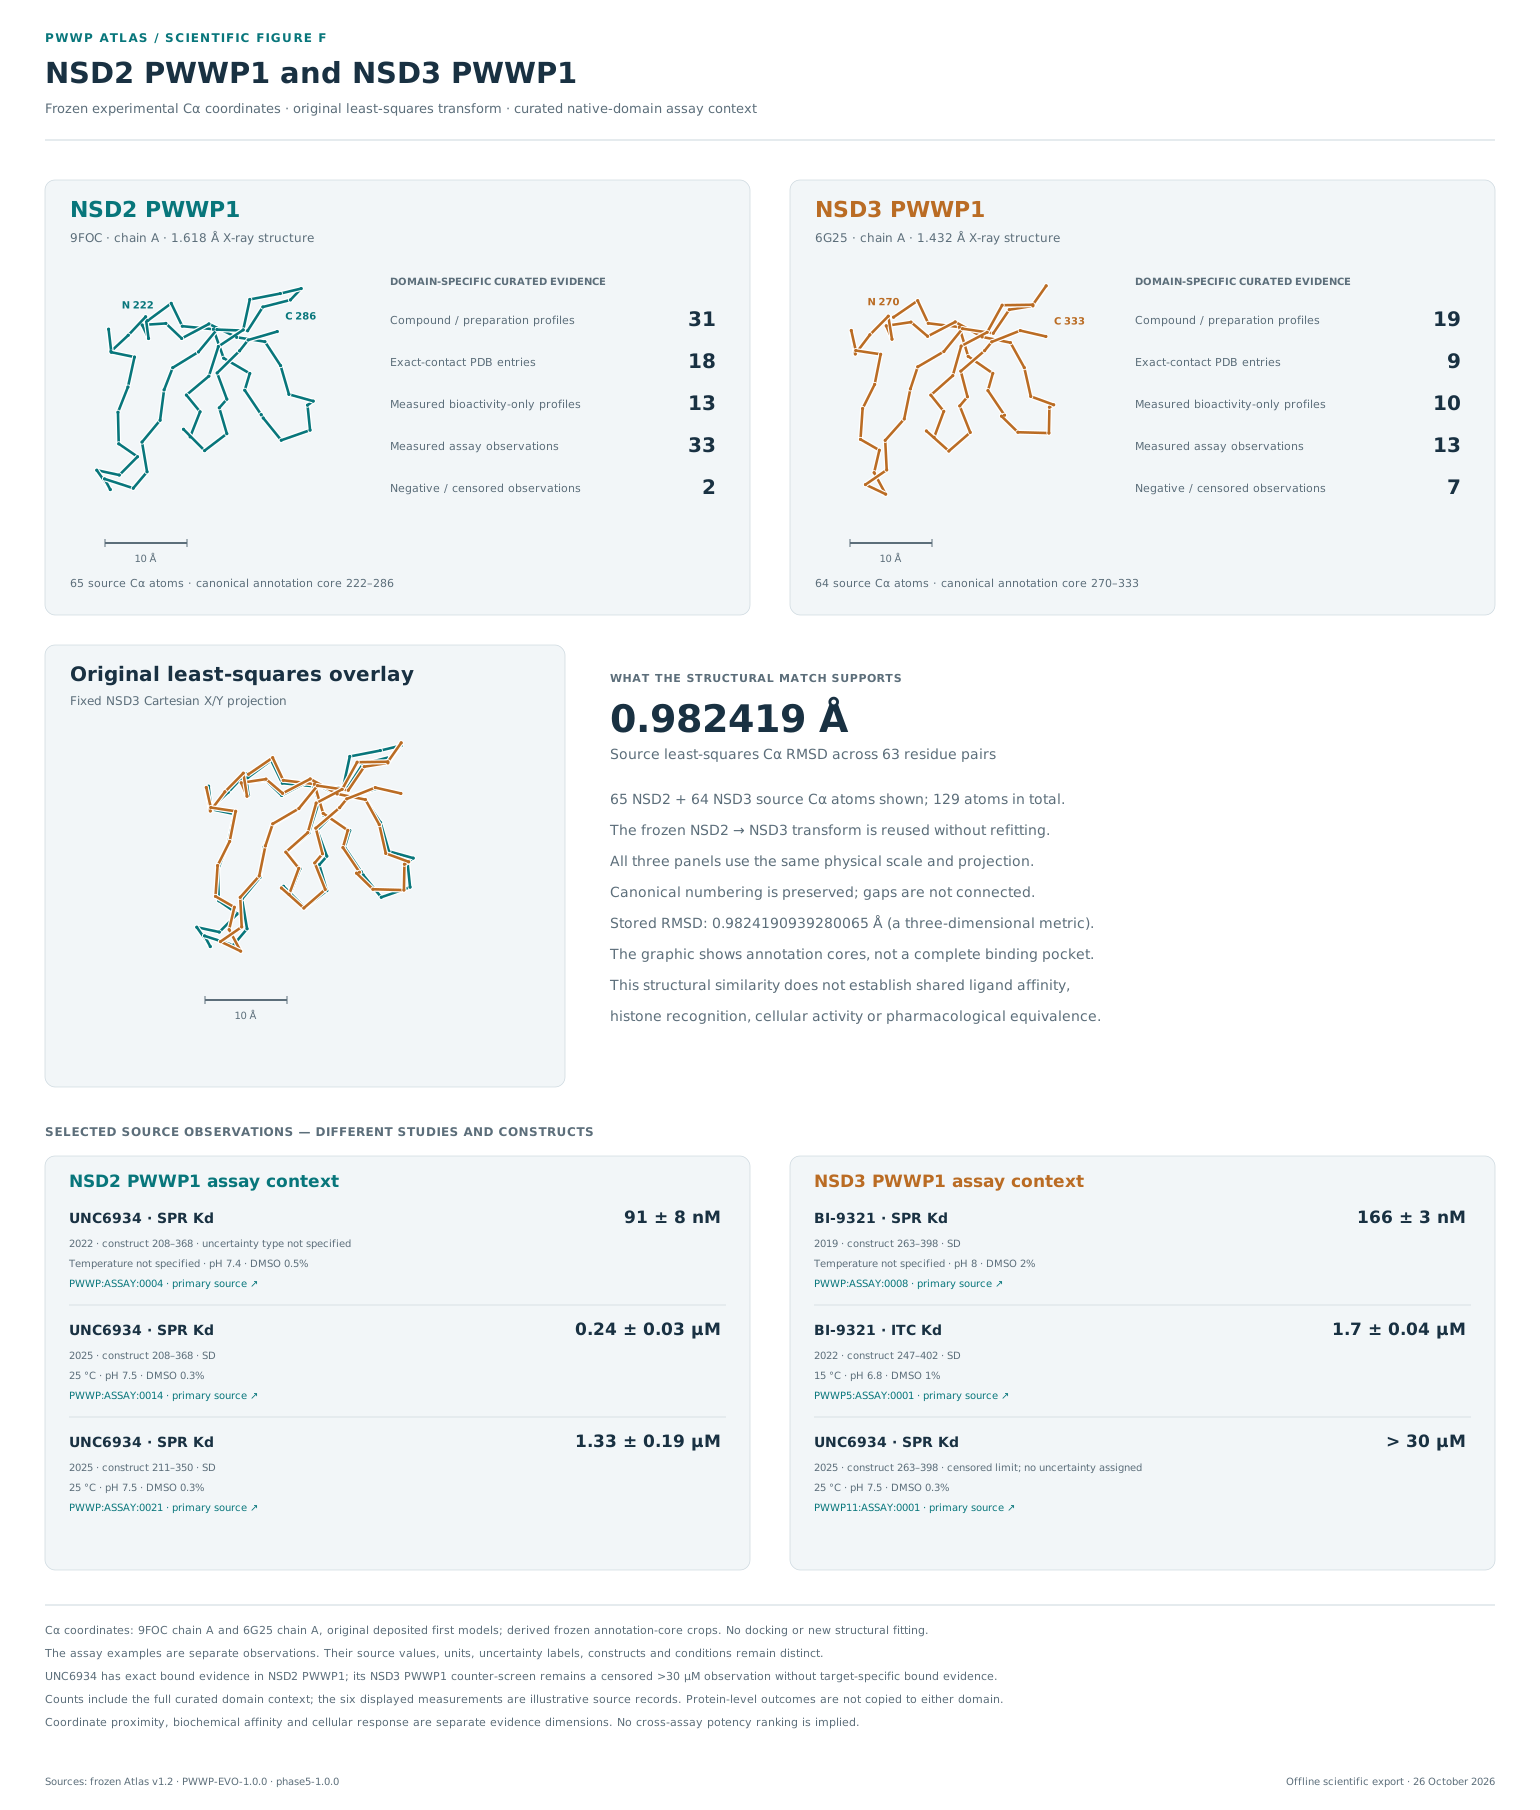
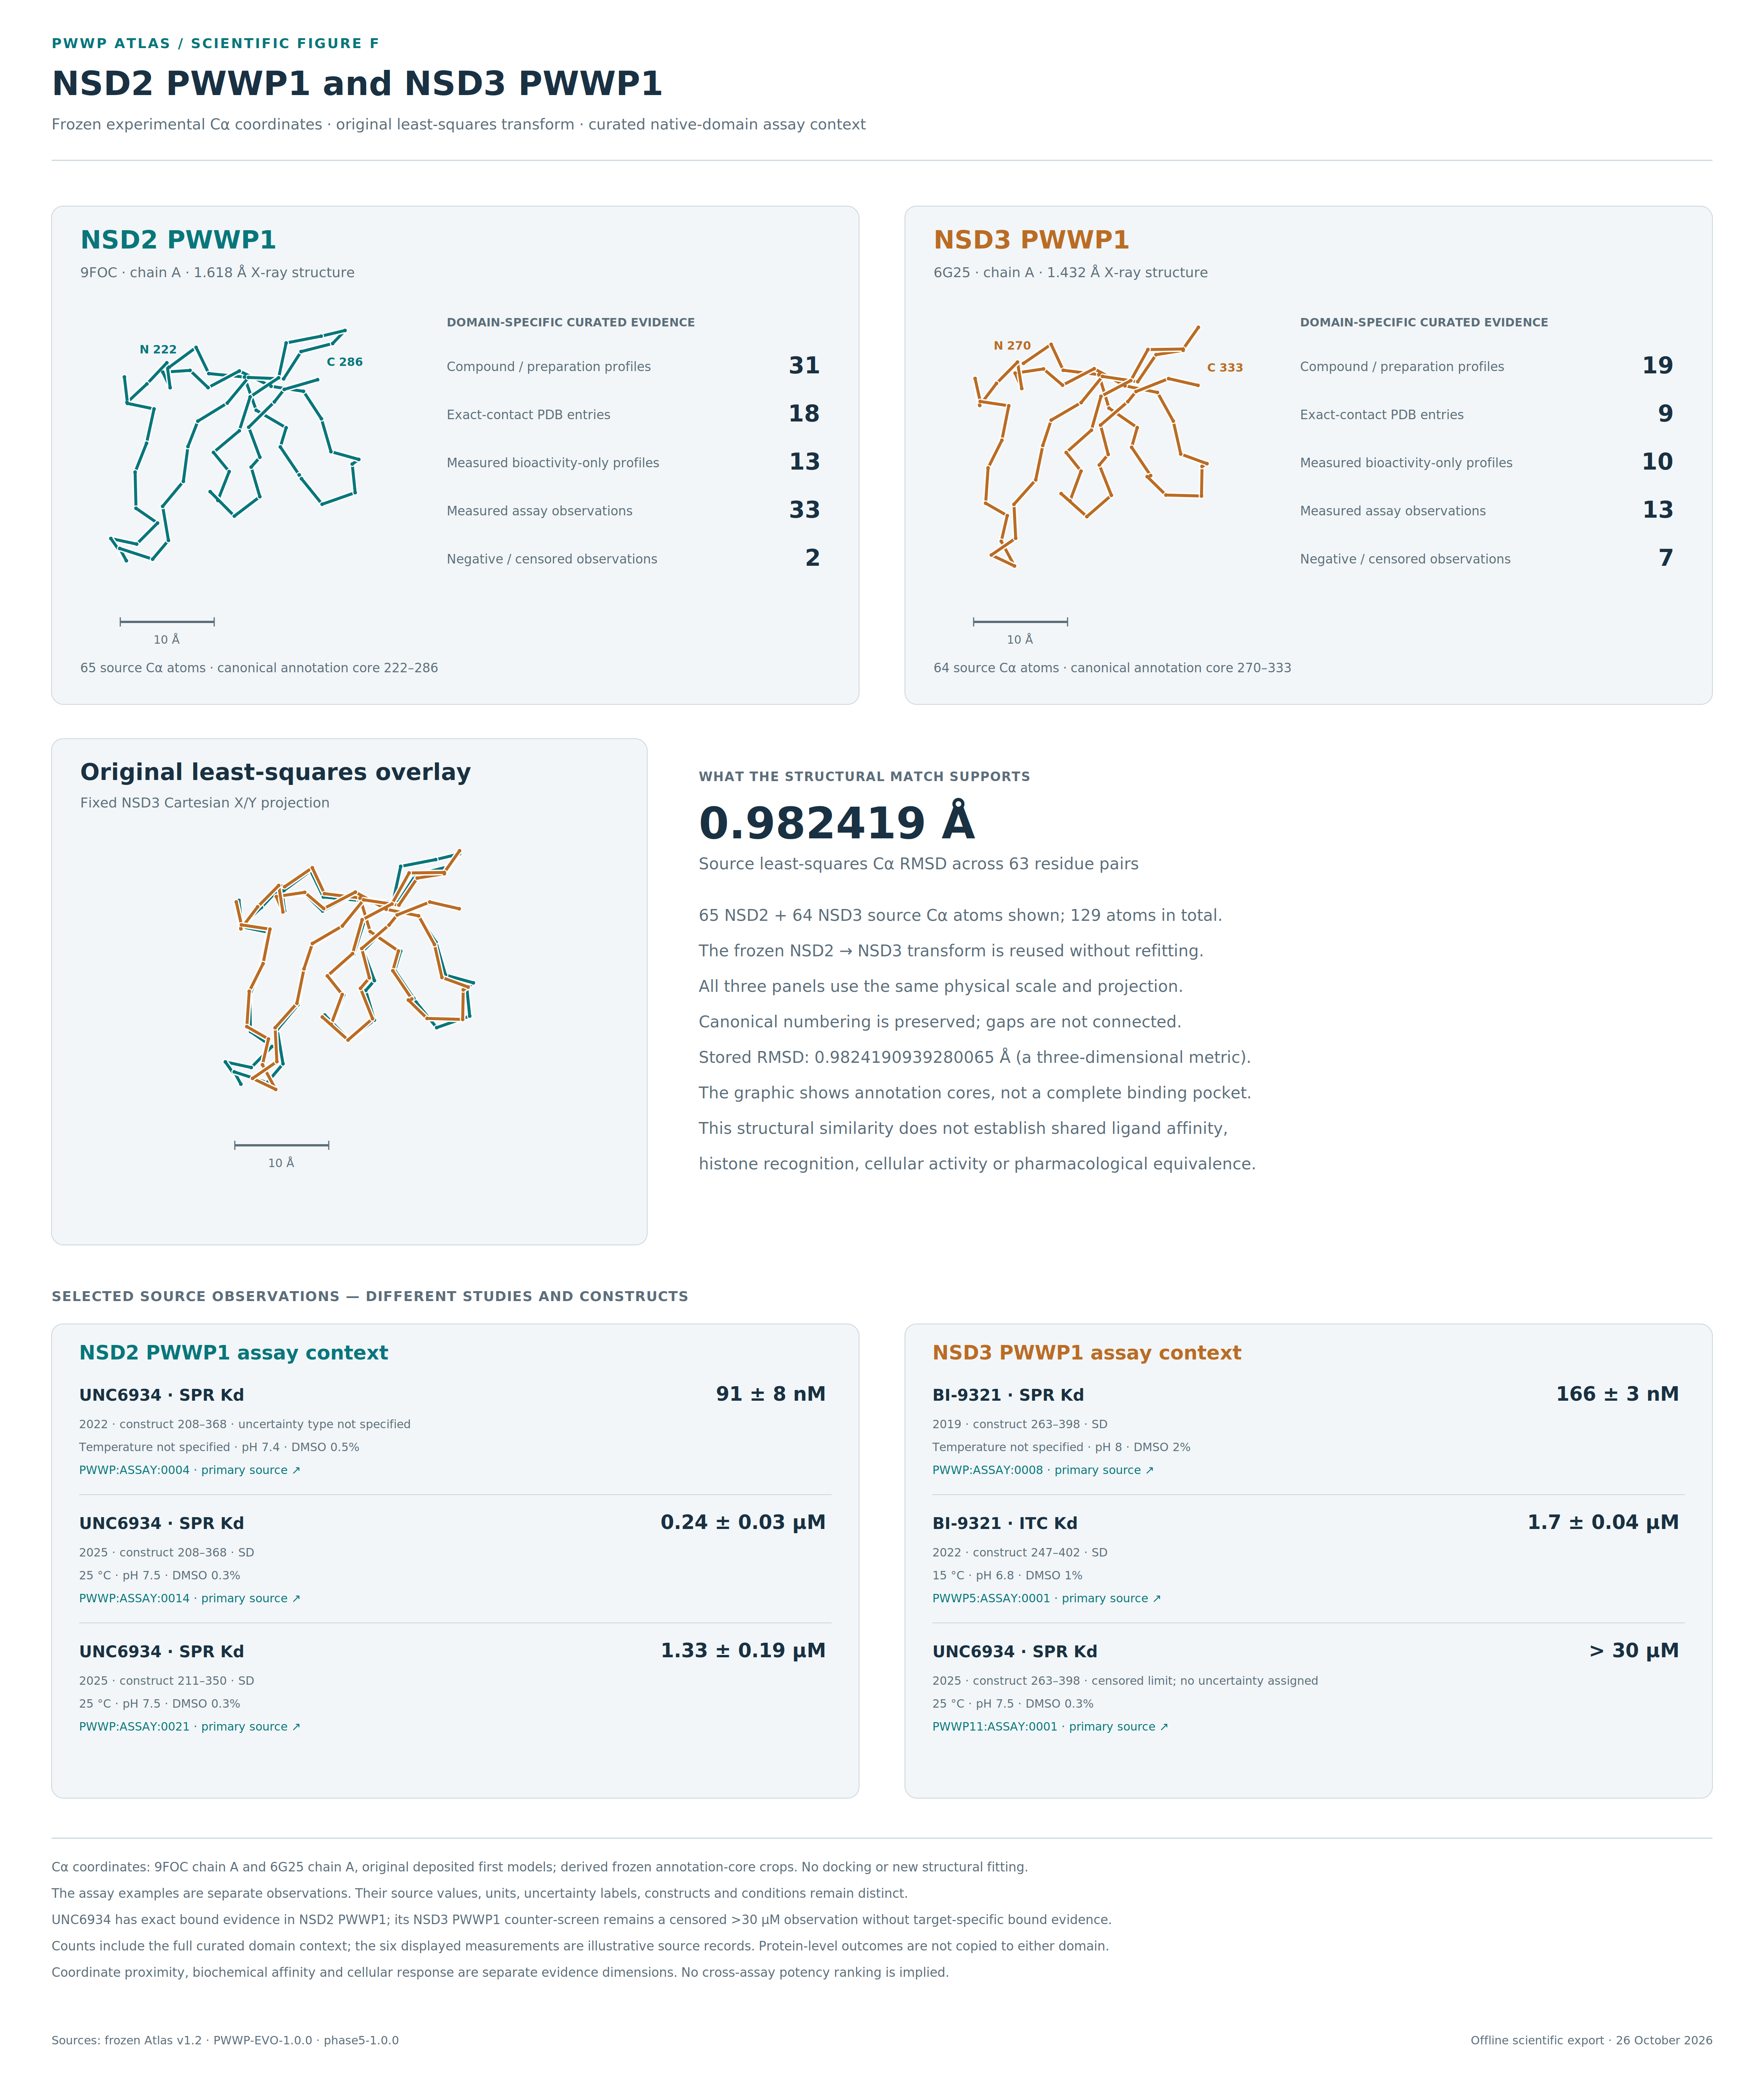
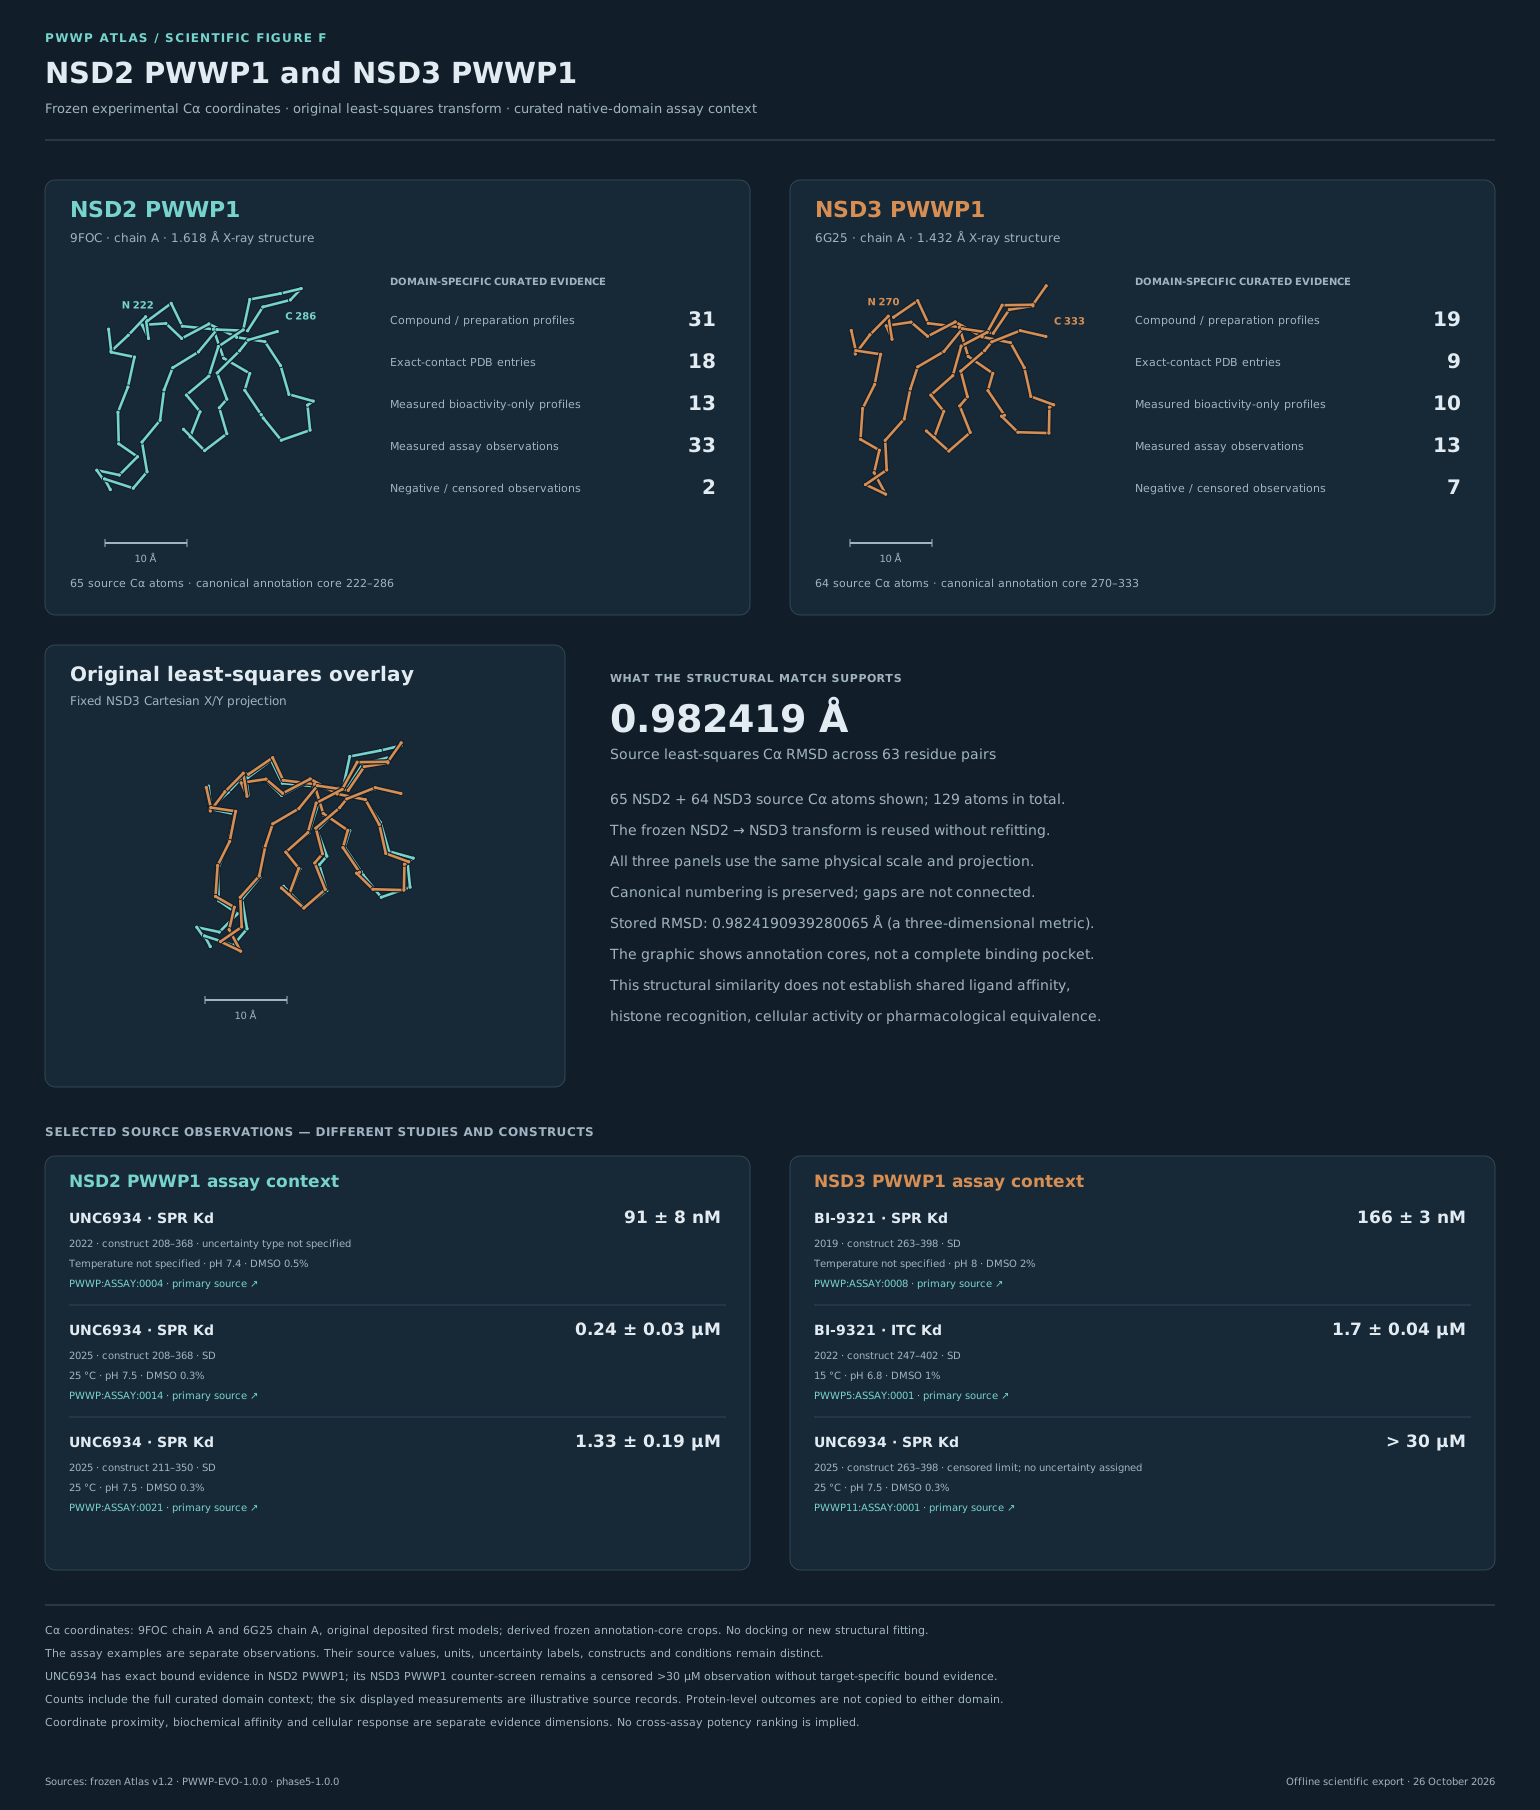
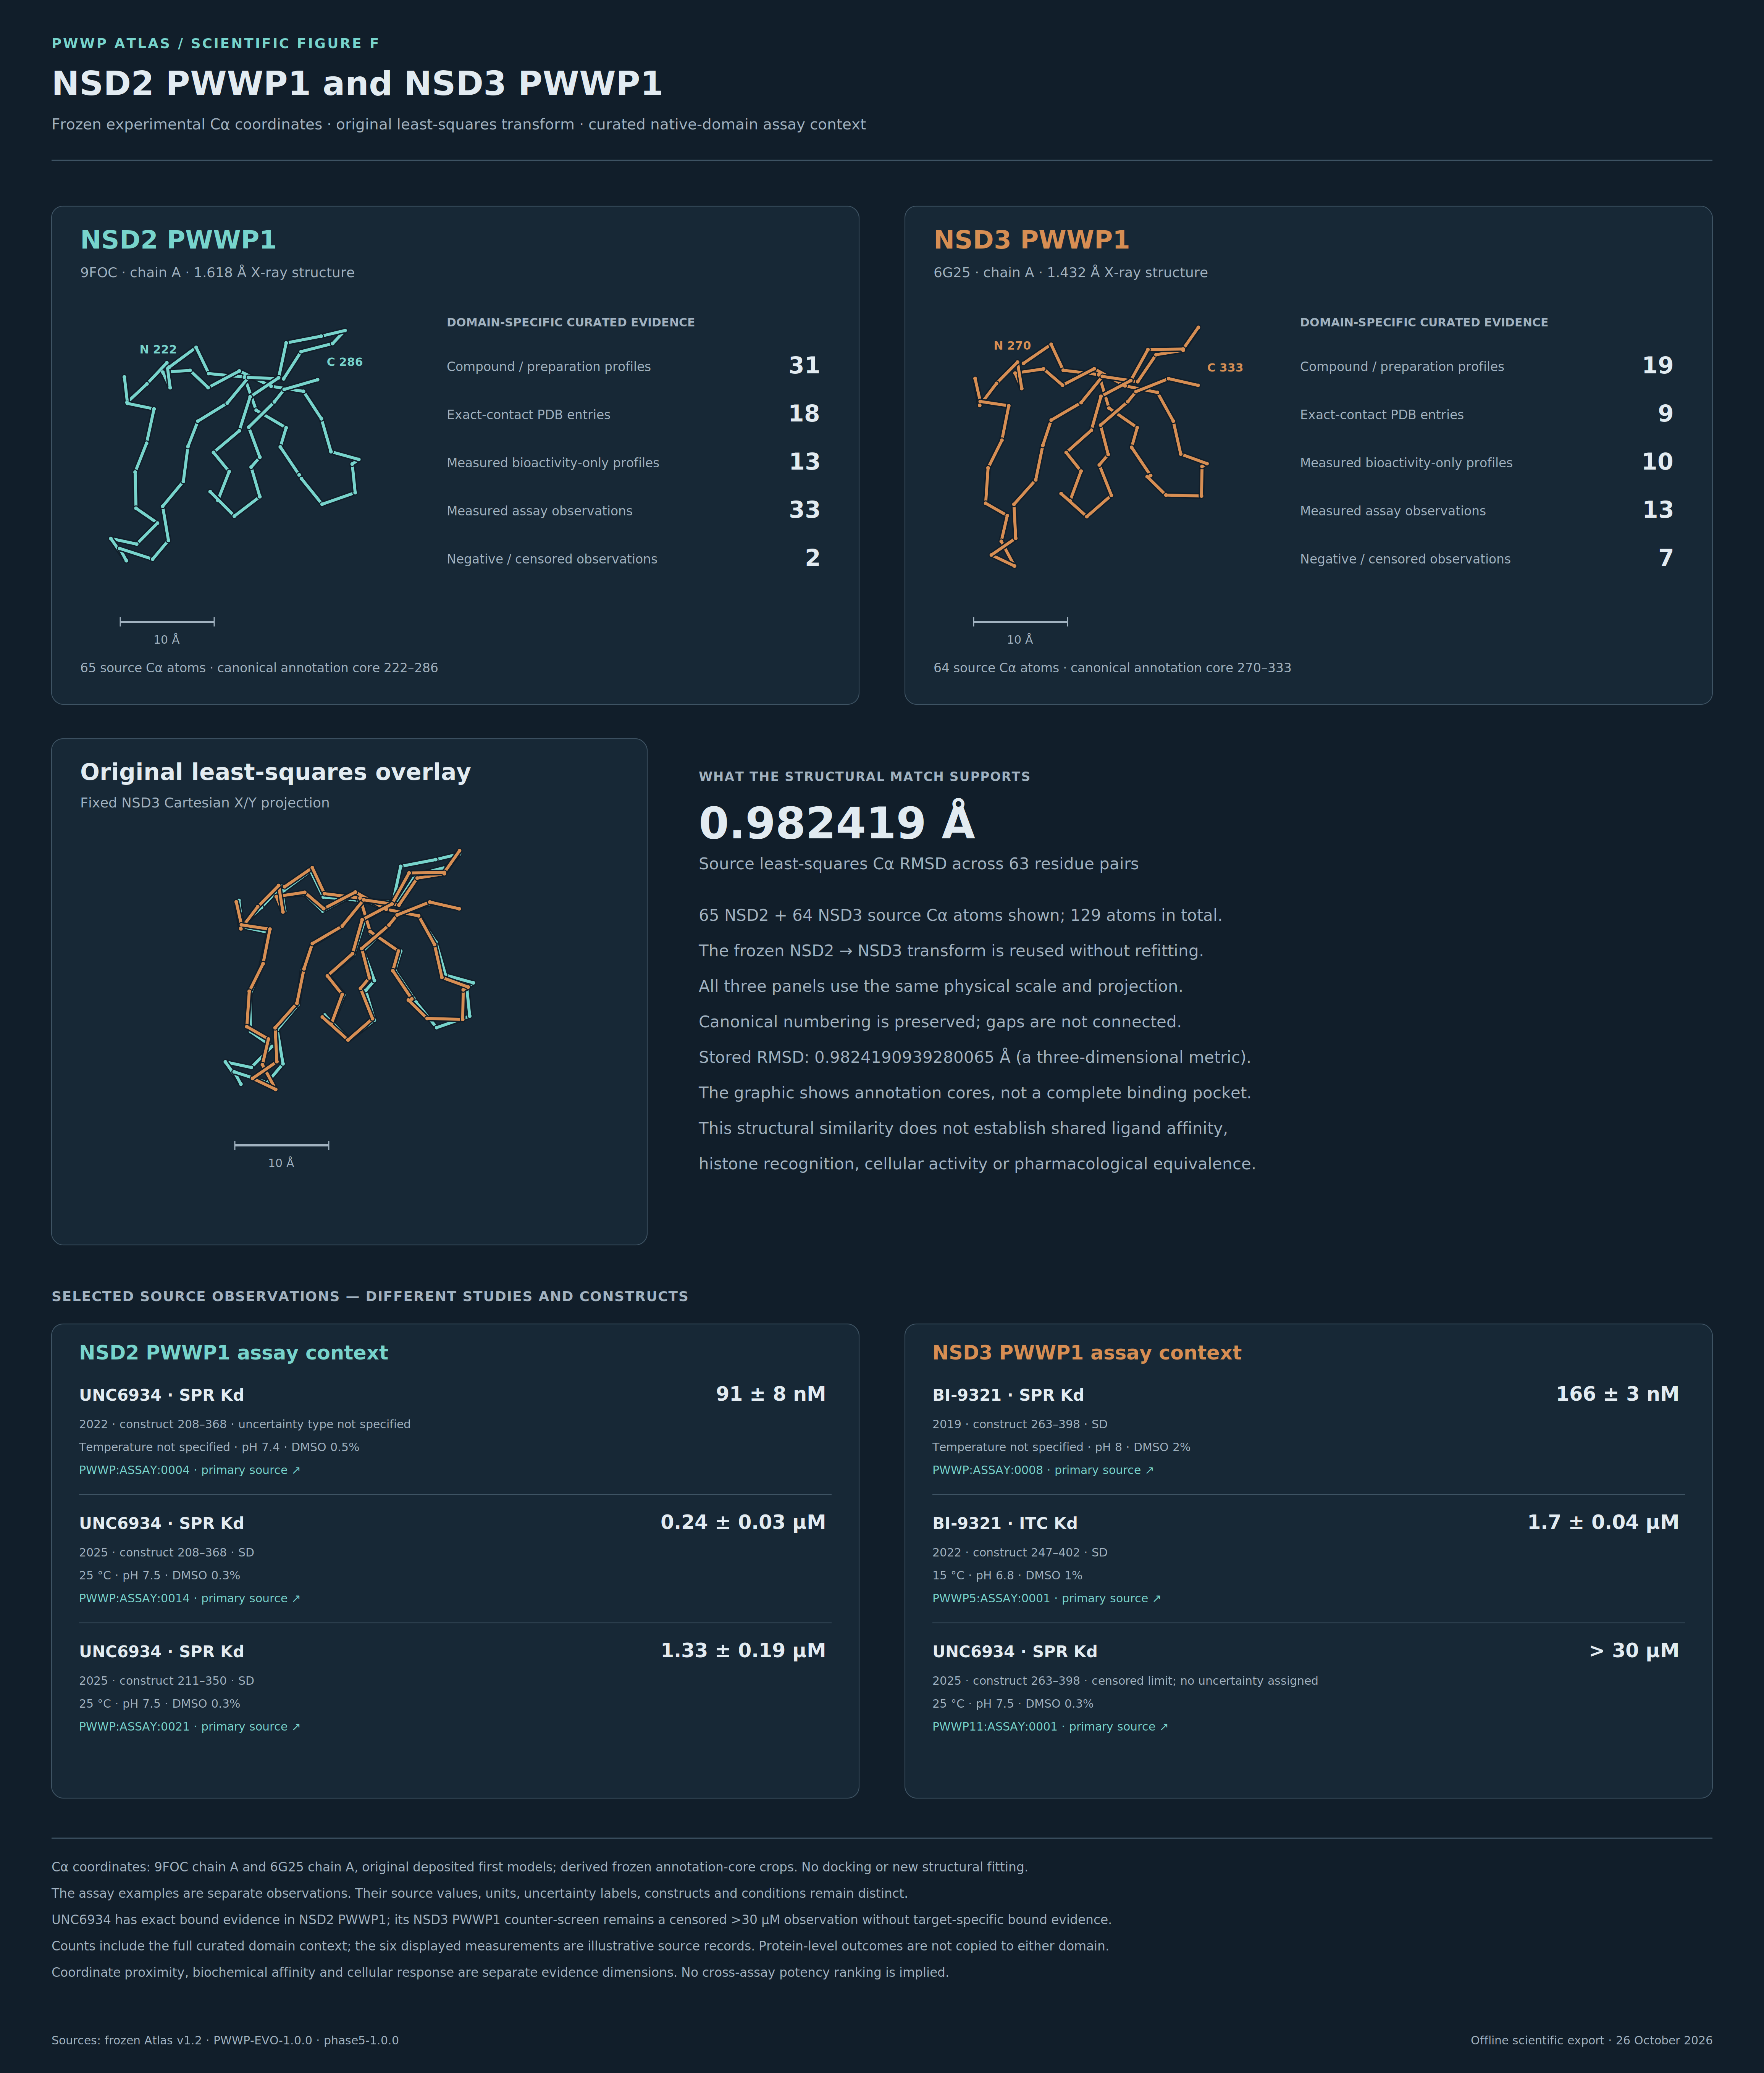
Figure F
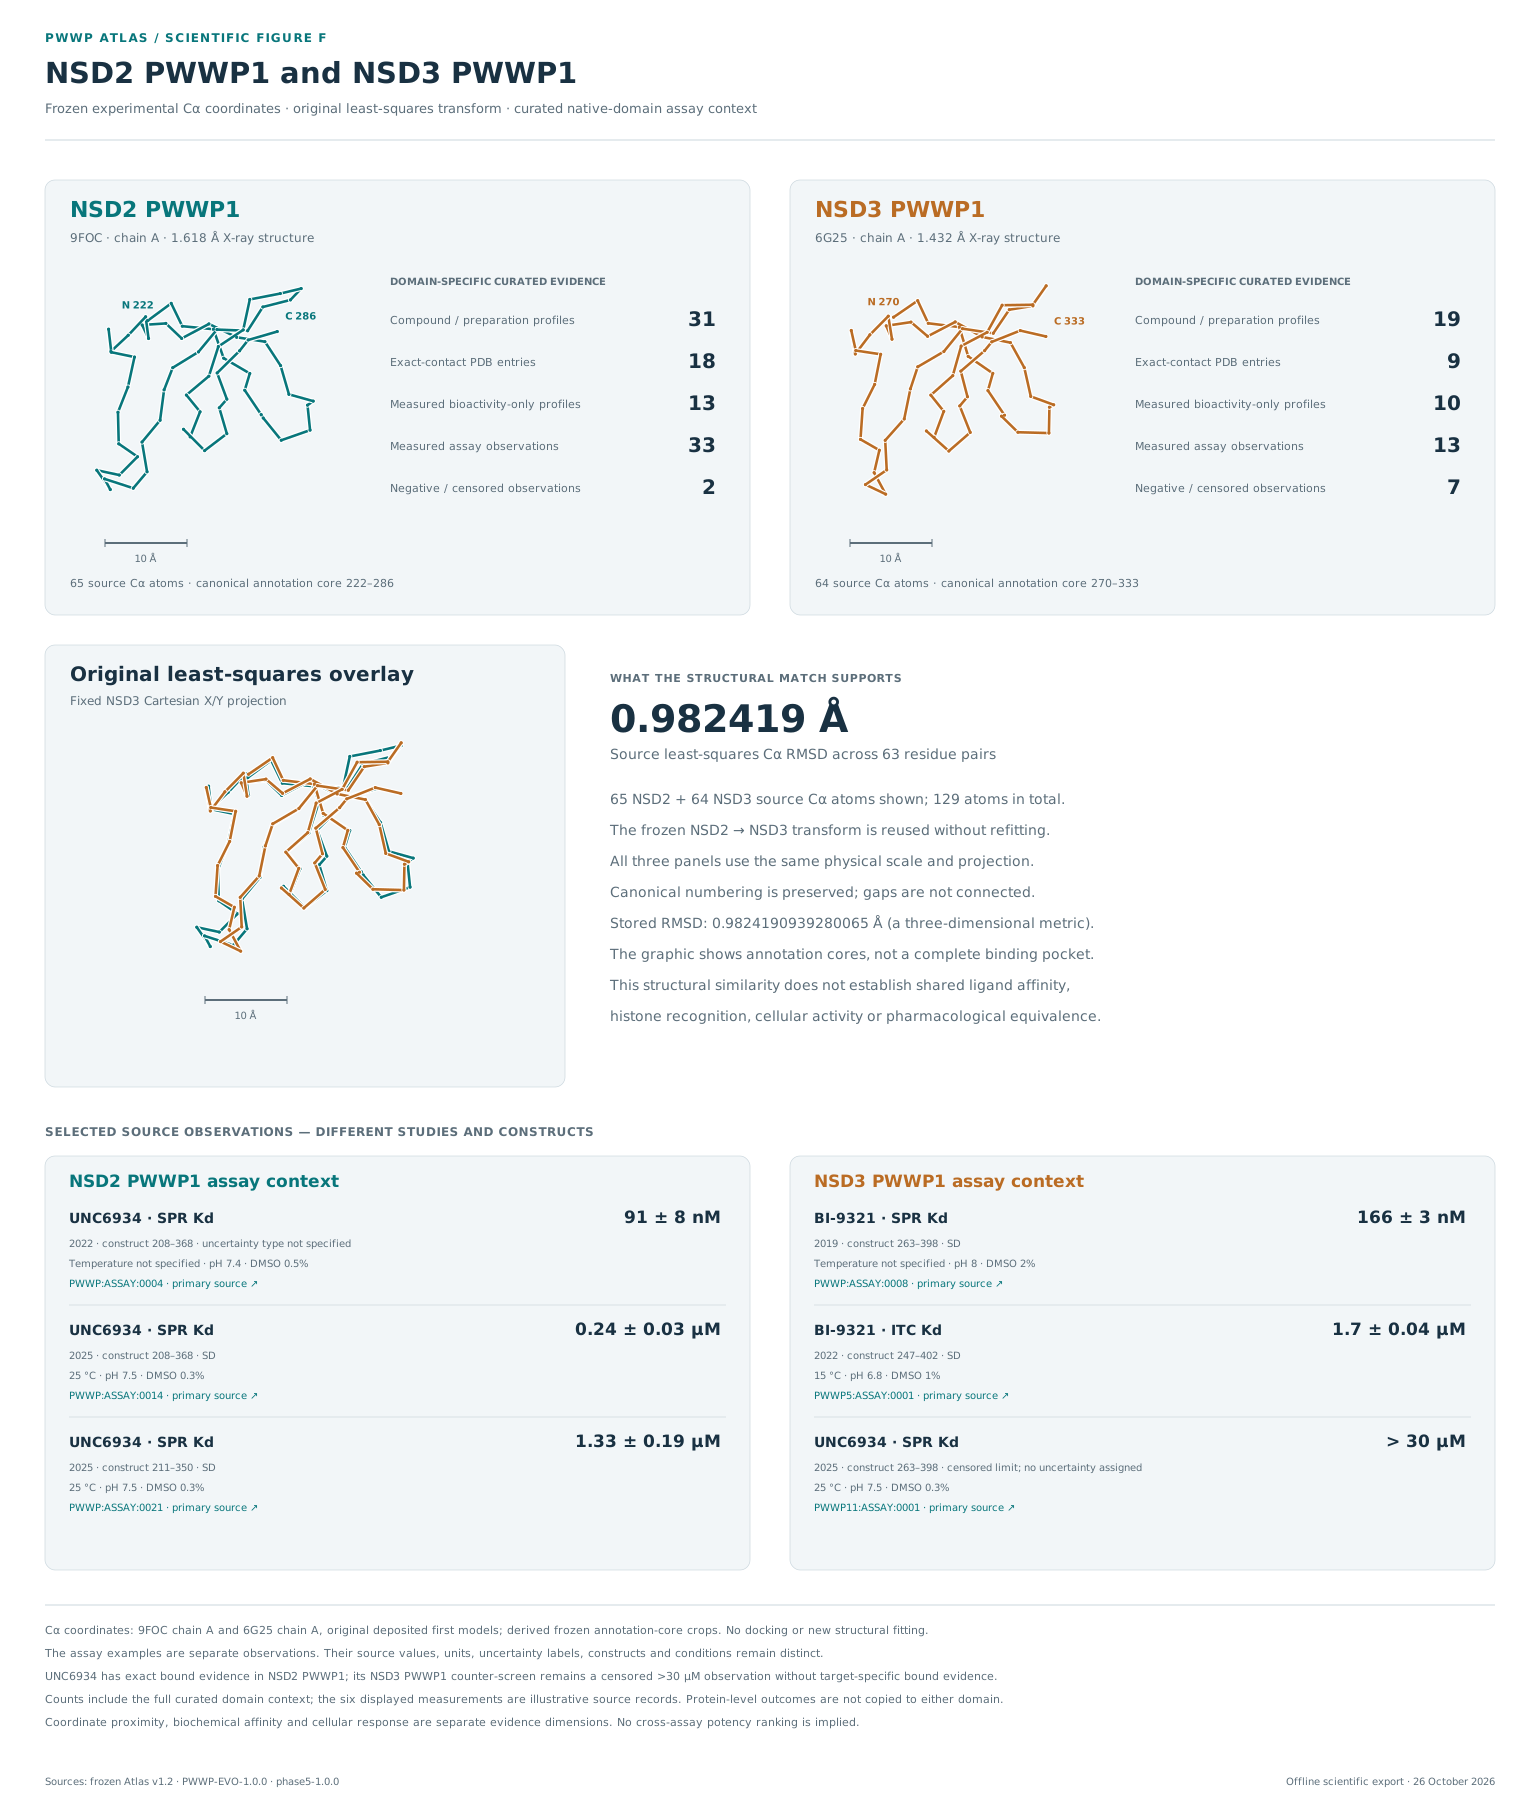
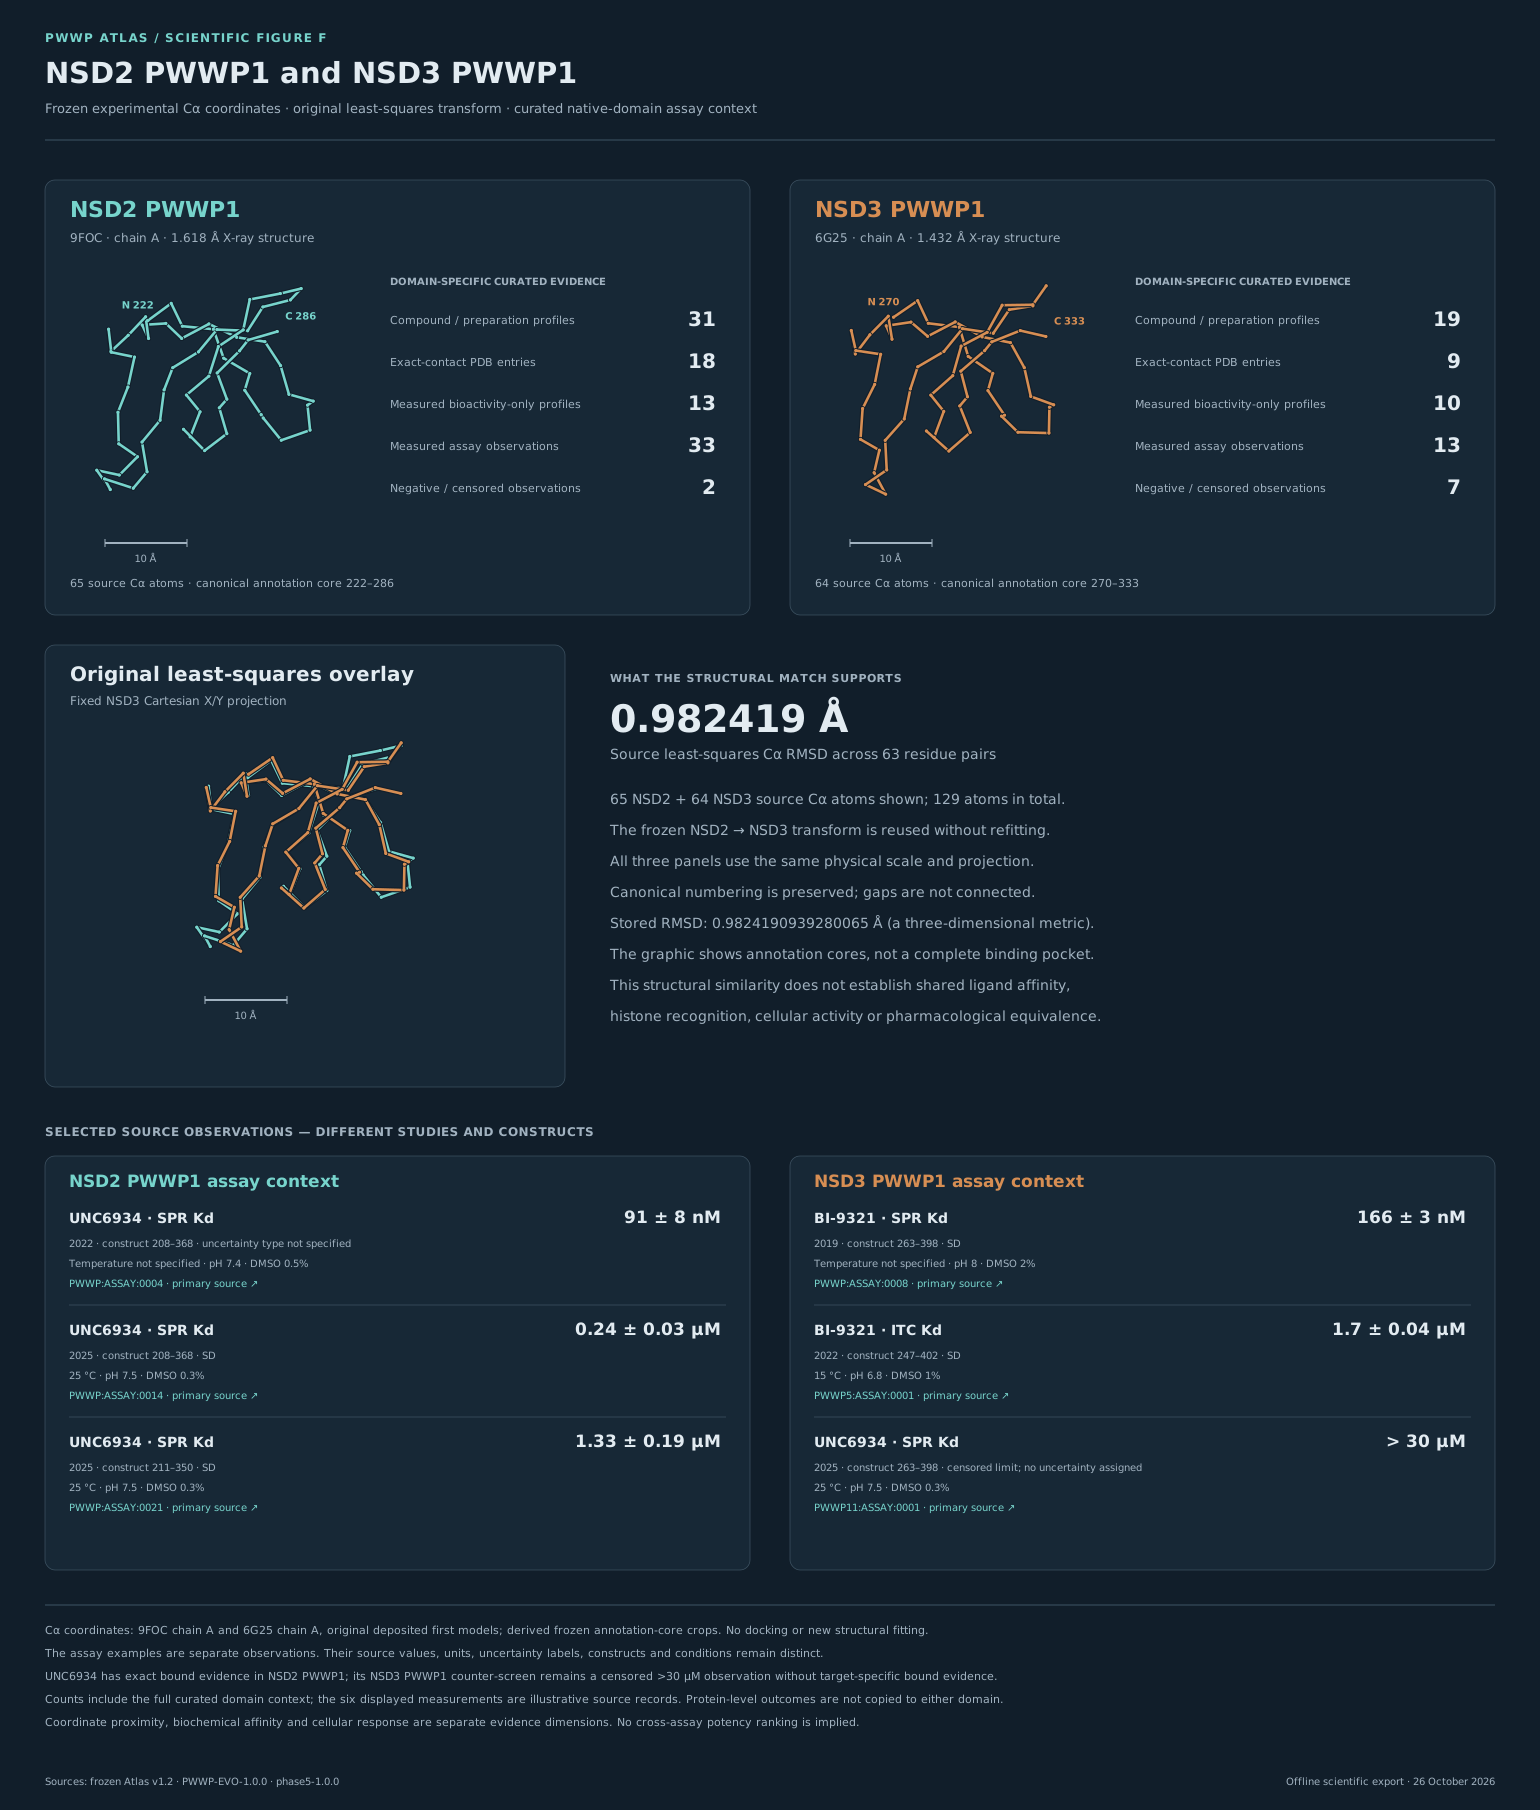
Frozen Cα coordinates under the original least-squares transform, domain-specific evidence and six separate source observations.
Reproducible scientific exports
The exact source snapshot, shared row geometry and interpretation notes accompany the figures. The figure manifest contains the output and source hashes. Its own served-byte SHA-256 is shown below; supporting files are verified against the hashes recorded in that manifest.
c4765569fe54f0fd5462fe735085eecf8fa55ef0c909c7eddbee9fed5d91756e
12 SVG files and 12 high-resolution PNG files; six figures in two themes. PNGs were rendered at 3× from their corresponding SVGs. Preview thumbnails in the release package are separate inspection aids and are not substituted for these exports.
Tree edge spacing in the support-collapsed representation has no evolutionary distance scale. Descriptive conservation, coordinate proximity and experimental bioactivity remain distinct evidence types. Figure E preserves target-specific profile denominators; Figure F preserves separate source observations.